NIFTY TECHNICAL ANALYSIS
Based on Market Closing on Wednesday, February 14, 2024
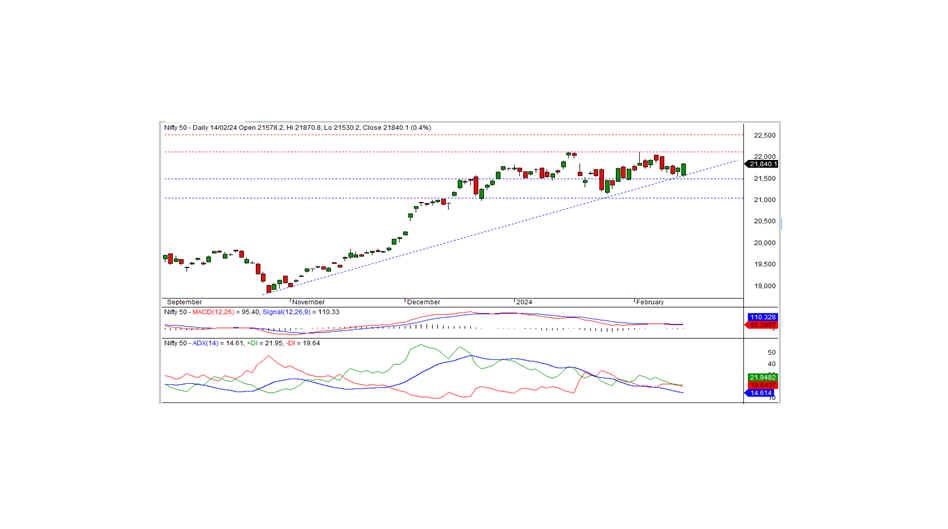
In the last trading session, the Nifty settled at 21840.05, marking a gain of 96.80 points or 0.45 percent. Sustaining above the 21800 mark suggests a continuation of the positive trend in the upcoming sessions.
The day commenced with a downward gap as the Nifty opened at 21578.20, reaching a morning low of 21530.20. However, the index surged subsequently, hitting an intraday high of 21870.80 before settling at 21840.05. Except for the IT and pharma sectors, all others closed with a positive bias, notably the PSU bank, media, metal, and auto sectors. The market breadth reflected positivity with 1574 stocks rising, 851 falling, and 109 remaining unchanged. Notable gainers beneath the Nifty included BPCL, SBIN, ONGC, and COALINDIA, while TECHM, CIPLA, SUN PHARMA, and DRREDDY experienced losses.
Technically, the Nifty sustains levels above both short-term and long-term moving averages, with momentum indicators signaling a positive trajectory. A white candle formation on the daily chart, along with closure above the upper boundary of the recent consolidation band (21500-21800), reinforces this sentiment. Should the index persist above 21800, the positive trend will likely continue, with the next notable resistance observed at 22125. For a robust bullish trend, a close beyond this level is crucial.
Intraday support and resistance levels are delineated as follows: Support: 21800-21725-21650 Resistance: 21870-21935-22000 (15 Minute Charts)
For positional traders, short-term support is evident at 21500-21000, countered by resistance at 22125-22500. These levels serve as crucial benchmarks for strategic decision-making

BANK NIFTY ANALYSIS
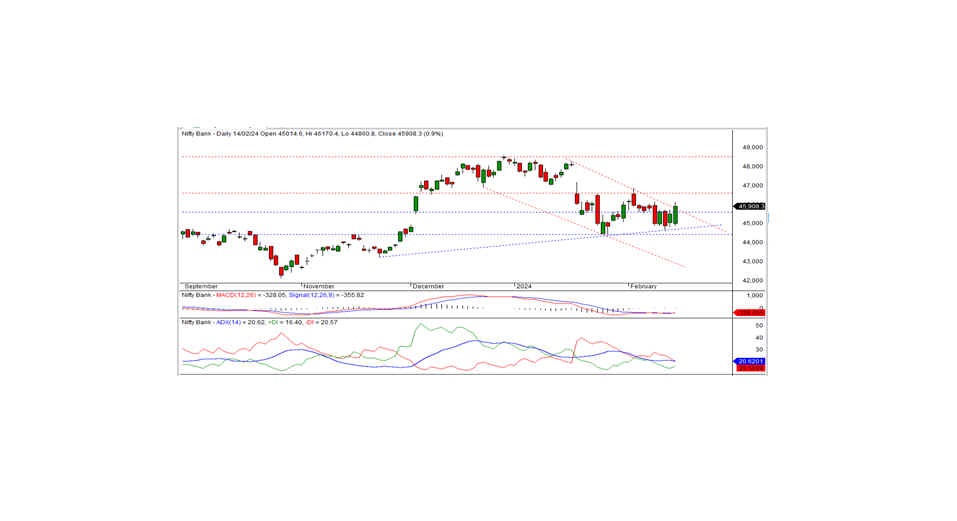
In the previous trading session, Bank Nifty concluded at 45908.30, marking an increase of 405.90 points. Technically, momentum indicators indicate a positive trend, with the index maintaining levels above both short-term and long-term moving averages. Additionally, a long white candle formation on the daily chart signals strength, closing above the previous resistance of 45600 and surpassing the upper boundary of the downward channel pattern. Sustaining above the 45600 level could extend the bullish trend in the forthcoming days, with the next short-term resistance noted at the 46600 level.
For intraday trading, support levels are identified at 45750, 45475, and 45200, while resistance levels are delineated at 46100, 46400, and 46650 based on the 15-minute charts.
Positional traders are advised to monitor short-term support levels at 45600-44450, with resistance anticipated at 46600-48500. These levels provide essential guidance for strategic decision-making and risk management.

