NIFTY TECHNICAL OUTLOOK
Based on the market closing on Tuesday, January 23, 2024
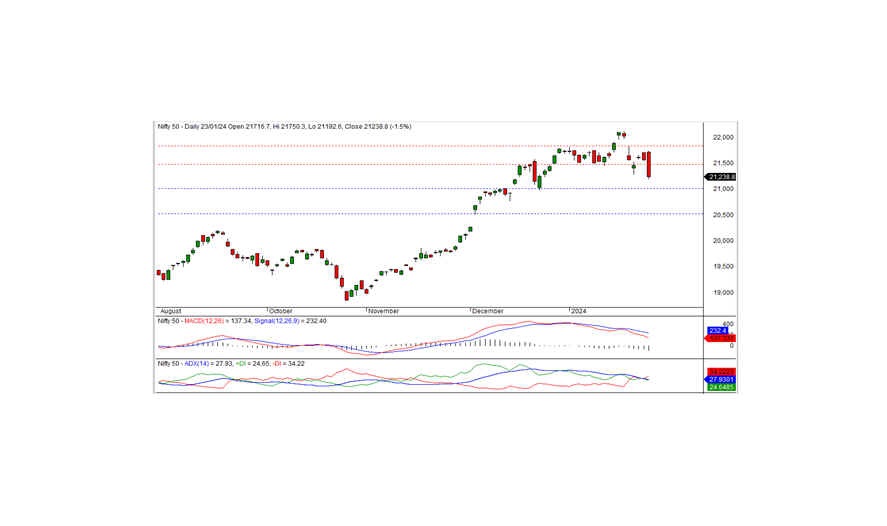
In the most recent trading session, the Nifty concluded at 21238.80, experiencing a decline of -333.00 points or -1.54 percent. Should the index drop below the intraday support level of 21200, it may sustain the downtrend today as well.
Commencing positively, the Nifty opened at the 21716.70 level and reached an intraday high of 21750.30 during the morning trade. Subsequently, the index sharply declined, hitting the intraday low of 21192.60, ultimately closing at 21238.80. Except for the pharma sector, all other sectors closed with a negative bias. Media, realty, metal, and bank sectors emerged as the primary losers. The market breadth exhibited negativity, with 1963 stocks rising, 488 falling, and 69 remaining unchanged. Beneath the Nifty, CIPLA, SUNPHARMA, BHARTIARTL, and ICICIBANK were the leading gainers, while INDUSINDBK, COALINDIA, ONGC, and ADANIPORTS faced notable losses.
From a technical perspective, the Nifty continues to remain below the short-term moving averages, with momentum indicators signaling a negative trend. The daily chart depicts the formation of a long black candle, closing below the previous day's closing level. On the downside, the index finds intraday support at 21200, and if it trades below this level, a further downtrend may occur today. The subsequent short-term support is positioned at 21000 levels, with the closest intraday resistance at 21300 levels.
Intraday Support Levels: 21200-21100-21000 Resistance Levels: 21300-21400-21500 (15 Minute Charts)
For positional traders, short-term support levels persist at 21000-20500, while resistance is noted at 21500-21835.
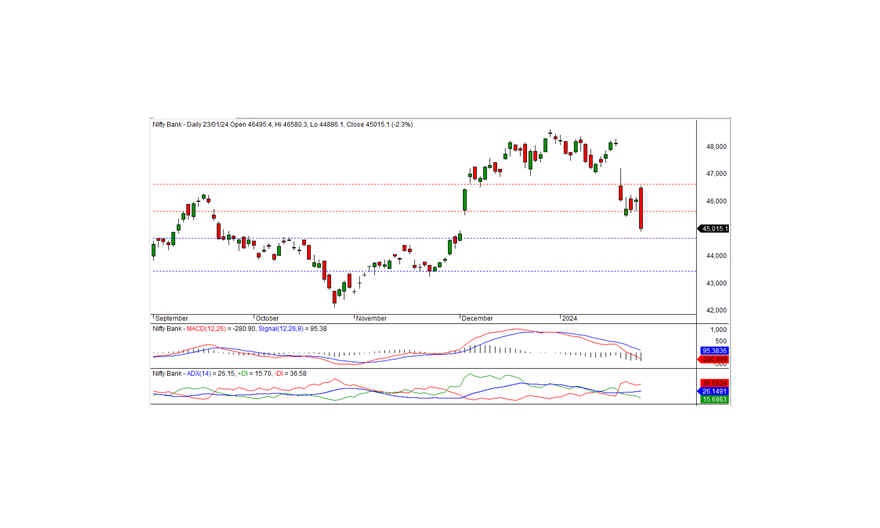
BANK NIFTY
In the latest trading session, Bank Nifty concluded at 45015.05, marking a loss of 1043.15 points. Analyzing from a technical standpoint, momentum indicators signify a negative trend, and the index persists below both short-term and medium-term moving averages. Furthermore, the daily chart illustrates the formation of a long black candle, closing significantly below the preceding day's close. All these indicate the possibility of continuing the negative trend. On the downside, the index finds intraday support at the 44900 level. If the index declines below this level, the bearish trend may extend in the upcoming days, with the subsequent short-term support noted at 44600 levels.
For intraday traders, the support levels are identified at 44900, 44600, and 44300, while resistance levels are denoted at 45200, 45450, and 45700, as indicated by the 15-minute charts.
Positional traders are advised to monitor short-term support levels at 44600-43500, with resistance noted at 45600-46600.