Nifty Technical Outlook
Based on Market Closing on Tuesday, October 1, 2024
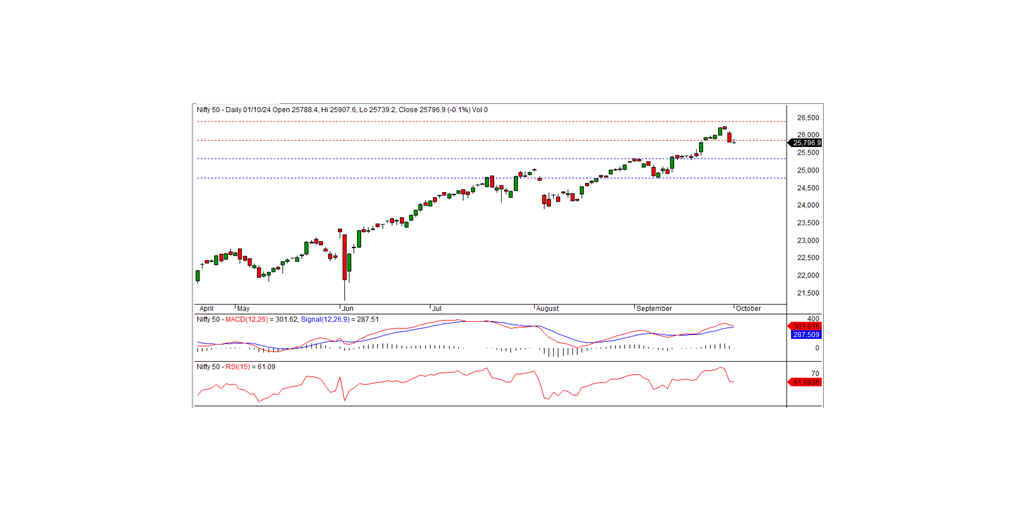
In the last trading session, the Nifty closed at 25,796.90, down by 13.95 points or 0.05%. The market experienced a slight decline, and bearish momentum could continue if the index breaks below the key intraday support level of 25,750.
The session began with a negative opening at 25,788.40, followed by a brief attempt to move higher, as Nifty tested the intraday high of 25,907.60 during the morning trade. However, the index soon lost ground and traded within a narrow range for the rest of the session, eventually closing slightly lower. Sector-wise, Media, IT, Metal, and Auto outperformed, while Realty, Private Banks, and FMCG led the declines. The market breadth remained positive, with 1,514 stocks advancing, 1,122 declining, and 95 unchanged. Among the top gainers were TECHM, M&M, BRITANNIA, and ADANIENT, while INDUSINDBK, ONGC, ASIANPAINT, and BAJAJ-AUTO were the major losers.
From a technical perspective, momentum indicators reflect a generally positive trend, as Nifty remains above its medium- and long-term moving averages However, the formation of a Doji candle on the daily chart, coupled with a close just below the previous session's level, suggests a potential shift towards a negative bias. On the downside, the index has immediate intraday support at 25,750, and a break below this level could lead to further weakness. On the upside, intraday resistance is seen at 25,850, which needs to be surpassed for any meaningful recovery.
Intraday Levels: Support: 25,750, 25,675, 25,600 Resistance: 25,850, 25,900–25,975 (15-Minute Charts)
Positional Trading Levels: Support: 25,350–24,750 Resistance: 25,850–26,400
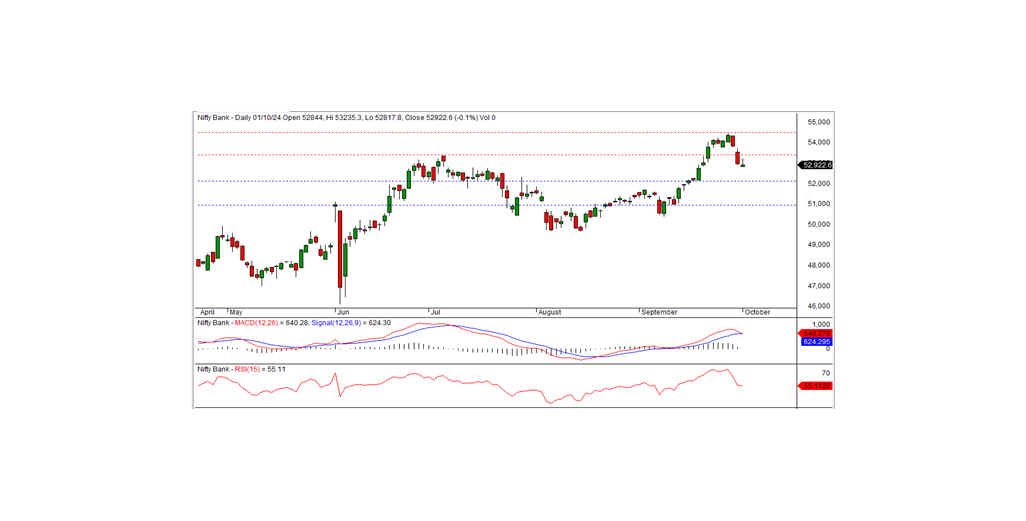
BANK NIFTY
In the previous trading session, Bank Nifty closed at 52,922.60, losing 55.50 points. Technically, while momentum indicators suggest a positive trend, the index remains below its short-term moving averages. It formed a small white candle on the daily chart but still closed lower than the previous session, indicating a continuation of the downward bias.
Bank Nifty remains in a precarious situation, with a negative bias persisting despite positive momentum indicators. The index's position below its short-term moving averages signals caution for traders. Immediate support lies at 52,800, and a break below this level could trigger further downside pressure. However, if Bank Nifty manages to stay above the key resistance of 53,000, there is potential for a pullback rally. Traders should watch these critical levels closely to gauge the next market direction
Intraday Levels Support: 52,800, 52,600, 52,400 Resistance: 53,000, 53,250, 53,500 (15-Minute Charts)
Positional Trading Levels: Support: 52,100–51,000 Resistance: 53,400–54,500