
NIFTY TECHNICAL OUTLOOK
Based on Market Closing on Friday, April 12, 2024
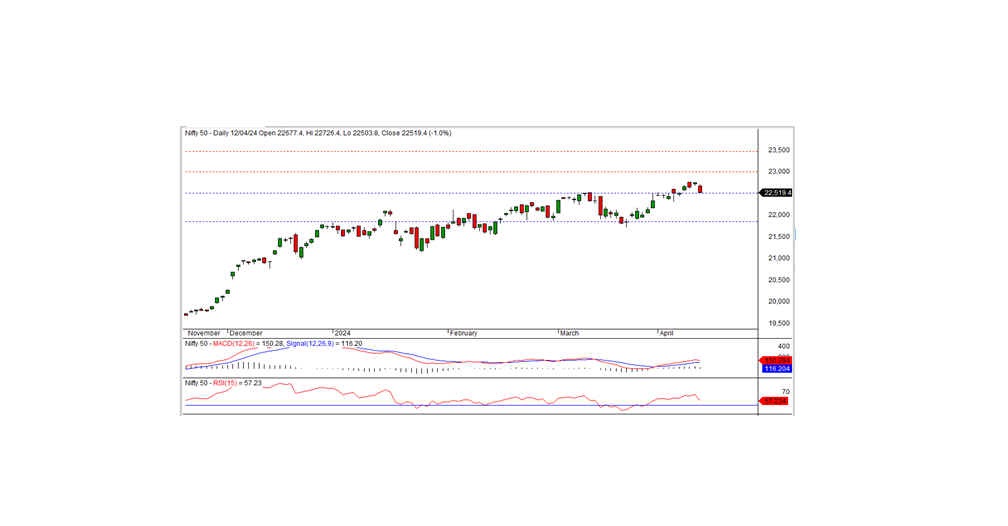
During the last trading session, the Nifty closed at 22519.40, marking a decline of -234.40 points or -1.03 percent. Should the Nifty sustain trading below the short-term support level of 22500, the downtrend is likely to persist.
Opening at 22677.40 on a negative note, the Nifty trended downward throughout the session, reaching an intraday low of 22503.80 before settling at 22519.40. All sectors closed with a negative bias, with notable declines observed in the pharma, PSU bank, media, and FMCG sectors. Market breadth leaned towards the negative, with 826 stocks witnessing gains, 1630 experiencing losses, and 136 remaining unchanged. Among Nifty components, top gainers included DIVISLAB, BAJAJ-AUTO, TATAMOTORS, and TCS, while notable losers comprised SUNPHARMA, MARUTI, POWERGRID, and TITAN.
Technically, the Nifty maintains positions above both short-term and long-term moving averages, with momentum indicators suggesting a positive trend. However, the index formed a black candle on the daily chart and closed near the short-term support level of 22500. Further downside movement may be anticipated if the index continues to trade and hold below this level; otherwise, a potential rebound rally could emerge from this support level.
Intraday Levels: Support - 22500, 22425, 22350 Resistance - 22565, 22630, 22700 (15-Minute Charts)
Positional Trading: Short-term support - 22500-21850 Resistance - 23000- 23500.
BANK NIFTY
In the previous trading session, Bank Nifty concluded at 48564.55, marking a decline of -422.05 points. Technically, momentum indicators continue to signal a positive trend, with the index maintaining positions above both short-term and long-term moving averages. Black candles on the daily chart and close near the short-term support level of 48500 raise caution. The downtrend could extend further if the index continues to trade and hold below this support level. The immediate intraday resistance is noted at the 48660 level, and for a potential pullback rally, the index would need to surpass this level.
Intraday traders may find support levels at 48500, 48300, and 48100, while resistance levels can be observed at 48660, 48830, and 49000, as indicated by the 15-minute charts.
For positional traders, monitoring short-term support levels at 48500-47000 is advisable, with resistance seen at 49500 -50500.
