NIFTY TECHNICAL ANALYSIS
Based on Market Closing on Friday, February 16, 2024
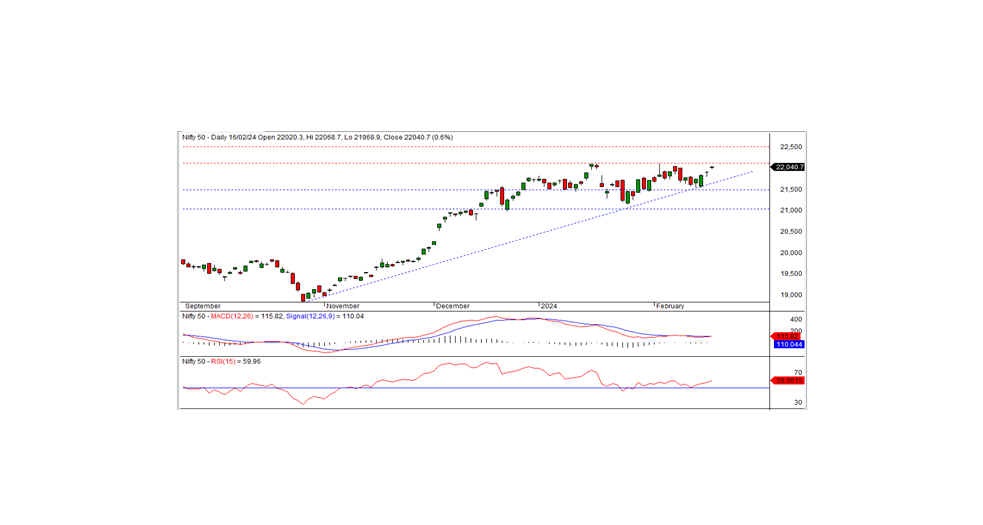
In the latest trading session, the Nifty closed at 22040.70, marking a gain of 129.95 points or 0.59 percent. Should the Nifty surpass the 22125 mark, a robust bullish trend could materialize in the forthcoming sessions.
The Nifty commenced trading at 22020.30 with a positive bias, maintaining its upward trajectory and reaching an intraday high of 22068.70 before settling at 22040.70. With the exception of PSU banks, all sectors concluded positively, with notable gains observed in the auto, pharma, realty, and IT sectors. The market exhibited positive breadth, with 1447 stocks advancing, 992 declining, and 99 remaining unchanged. Notable gainers beneath the Nifty included WIPRO, M&M, SBILIFE, and ADANIPORTS, whereas POWERGRID, ONGC, SBIN, and BRITANNIA faced significant losses.
From a technical standpoint, the Nifty remains positioned above both short-term and long-term moving averages, with momentum indicators signaling a positive trend. Despite forming a Doji candle on the daily chart, the index closed higher than the previous day, indicating a positive bias. Resistance for the Nifty stands at 22125 levels, and a breach beyond this level could sustain the bullish momentum. Conversely, failure to breach this level may result in consolidation below it for a few days. The closest intraday support lies at 21975 levels.
Intraday Levels: Support: 21975 - 21900 - 21800 Resistance: 22065 - 22125 - 22225 (15 Minute Charts)
For Positional Traders: Short-term support levels persist at 21500 - 21000, with resistance noted at 22125 - 22500.
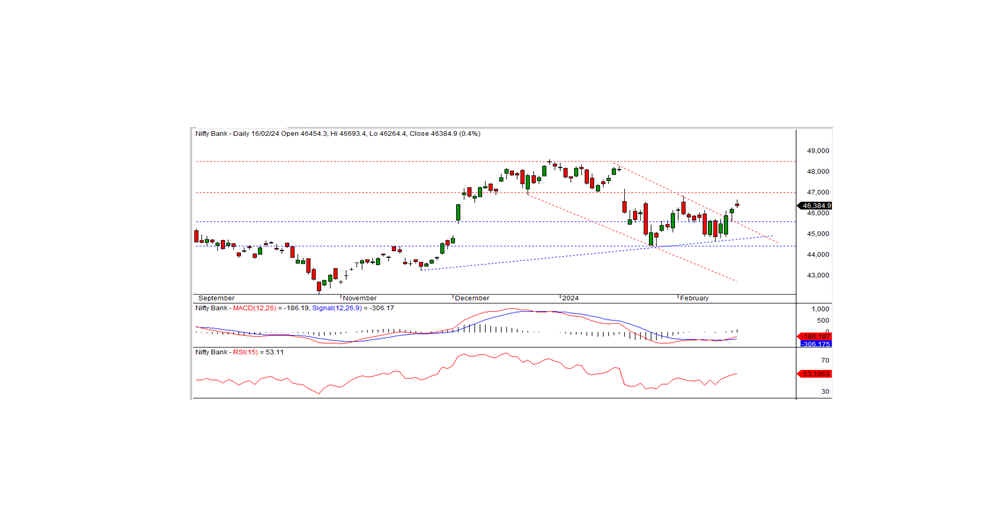
BANK NIFTY TECHNICAL ANALYSIS
During the preceding trading session, Bank Nifty concluded at 46384.85, marking a gain of 165.95 points. Technically, momentum indicators suggest a positive trend, with the index maintaining positions above both short-term and long-term moving averages. Despite forming a small black candle on the daily chart, the index closed higher than the previous day, indicating continued bullish momentum.
The nearest intraday support for Bank Nifty stands at 46250, while resistance is identified at 46600. A breakthrough above the 46250 resistance level could sustain the bullish trajectory in the upcoming sessions, with the subsequent short-term resistance noted at 47000 levels.
For intraday traders, support levels are observed at 46250, 46000, and 45700, while resistance levels can be identified at 46600, 46850, and 47200, as indicated by the 15-minute charts.
Positional traders are advised to monitor short-term support levels at 45600-44450, with resistance zones marked at 47000 - 48500.