
NIFTY TECHNICAL UPDATE
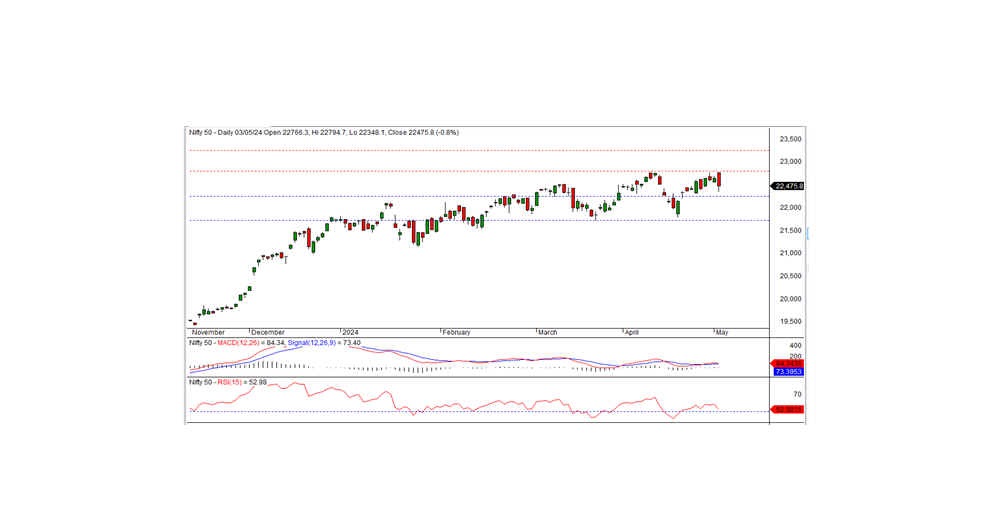
As of the market close on Friday, May 03, 2024, the Nifty concluded at 22475.80, marking a decline of -172.35 points or -0.76 percent. The bearish sentiment may persist if the Nifty continues to trade below the intraday support level of 22400.
During the last trading session, the Nifty commenced at 22766.30, showing an initial positive trend, and reached a record high of 22794.70. However, the index faced a sharp downturn, touching an intraday low of 22348.10 before settling at 22475.80. Apart from FMCG, all sectors closed with a negative bias, with realty, IT, auto, and PSU banks being the notable losers. Market breadth leaned towards the negative side, with 884 stocks rising, 1572 falling, and 146 remaining unchanged. Among the top performers in the Nifty were COAL INDIA, GRASIM, ONGC, and DRREDDY, while notable decliners included LT, MARUTI, NESTLEIND, and RELIANCE.
Technically, the Nifty continues to hover above both medium-term and long-term moving averages, with momentum indicators signaling a positive trend. However, a long black candlestick formed on the daily chart, closed below the previous day's level, resembling a bearish engulfing pattern. This pattern suggests a potential slowdown in the recent uptrend, possibly indicating a shift toward a downward trend. Confirmation of this trend reversal would necessitate the index to consistently trade below the bearish engulfing pattern in the forthcoming sessions. Intraday support for the index lies within the range of 22400-22350, and breaching this zone could sustain the downtrend. Alternatively, intraday resistance is anticipated around 22550 levels, surpassing this level may lead to a pullback rally.
Intraday Levels: Support - 22400, 22300, 22225 Resistance - 22550, 22650-22750 (15-Minute Charts)
Positional Trading: Short-term support - 22250-21700 Resistance - 22800-23250
BANK NIFTY UPDATE
In the previous trading session, Bank Nifty concluded at 48923.60, marking a loss of -307.50 points. From a technical perspective, momentum indicators continue to signal a positive trend, with the index maintaining its position above both short-term and long-term moving averages. However, a black candlestick formation on the daily chart, closing below the previous day's level, suggests a slight negative bias.
The index has support at the 48700 level, If the index breaches the 48700 level, the downtrend could continue. Conversely, the nearest intraday resistance is anticipated at the 49130 level, for a pullback rally the index needs to surpass this level.
For intraday traders, key support levels are identified at 48700, 48375, and 48100, while resistance levels can be monitored at 49130, 49580, and 49950, as per the 15-minute charts.
Positional traders are advised to monitor short-term support zones within the range of 48500-47000, with resistance levels observed at 49500-50500.
