NIFTY TECHNICAL OUTLOOK
Based on Market Closing on Wednesday, May 8, 2024
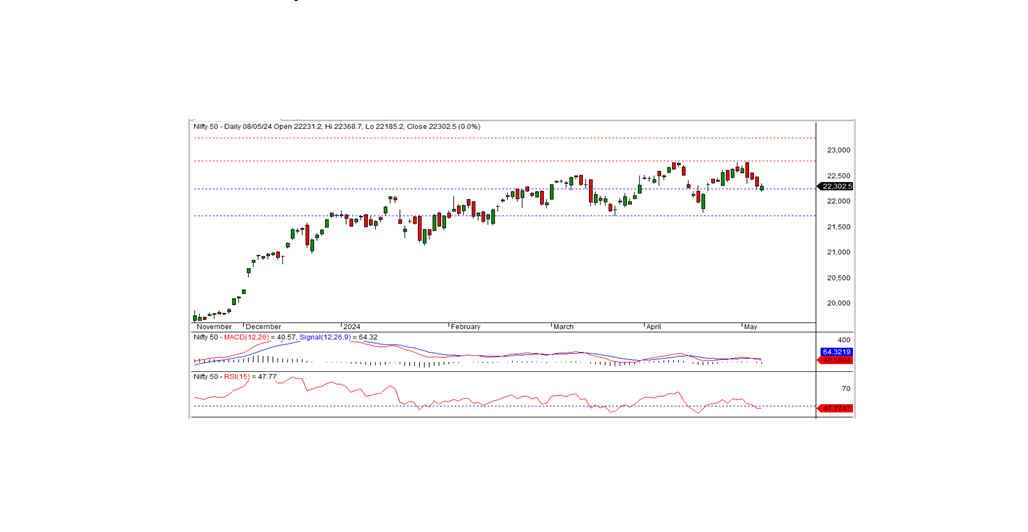
The Nifty concluded without any movement in the recent trading session, closing at 22,302.50. A downward trend is likely to persist if the Nifty closes below the short-term support level of 22,250.
The Nifty opened at 22,231.20 and hit an intraday low of 22,185.20 during morning trades. Subsequently, the index saw a gradual uptick, reaching an intraday peak of 22,368.70 before settling at 22,302.50. Notable sector gainers included auto, metal, PSU banks, and media, whereas banks, financial services, and IT experienced declines. Market breadth favored positivity, with 1,382 stocks advancing, 1,099 declining, and 122 remaining unchanged. Leading the Nifty gainers were HEROMOTOCO, BPCL, TATAMOTORS, and POWERGRID, while prominent losers comprised DRREDDY, ASIANPAINT, GRASIM, and ULTRACEMCO.
Technically, the Nifty continues to trail below short-term moving averages, with momentum indicators signaling a negative trajectory. However, the formation of a small white candle on the daily chart, coupled with a close at the previous day's level, suggests a potential consolidation phase. Notably, the Nifty holds short-term support at 22,500 levels; a close below this level could extend the downtrend. Alternatively, for a pullback rally to materialize, it must exceed the intraday resistance level at 22,370.
Intraday Levels: Support - 22,240, 22,150, 22,050 Resistance - 22,370, 22,500-22,600 (15-Minute Charts)
Positional Trading: Short-term Support - 22,250-21,700 Resistance - 22,800-23,250

BANK NIFTY
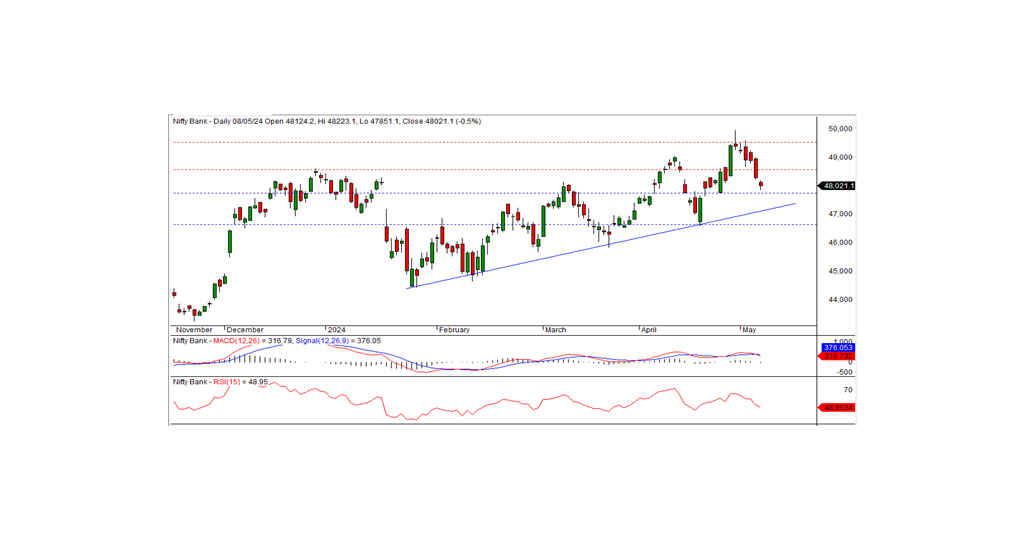
In the previous trading session, Bank Nifty concluded at 48,021.10, marking a decline of -264.25 points. Technically, momentum indicators signal a negative trend, with the index lingering below short-term moving averages. Furthermore, a black candle formed on the daily chart, closing below the previous day's level, suggesting a potential continuation of the downtrend. At present, the index finds short-term support at the 47,750 level. Should the index close below this mark, the downtrend could persist in the days ahead. The closest intraday resistance is noted at 48,200; for a pullback rally, the index needs to surpass this threshold.
For intraday traders, support levels are identified at 47,900, 47,650, and 47,400, while resistance levels are marked at 48,200, 48,450, and 48,730, as per the 15-minute charts.
Positional traders are advised to monitor short-term support levels at 47,750-46,650, with resistance observed at 48,500-49,500.

