NIFTY TECHNICAL OUTLOOK
Based on Market Closing on Tuesday, April 30, 2024
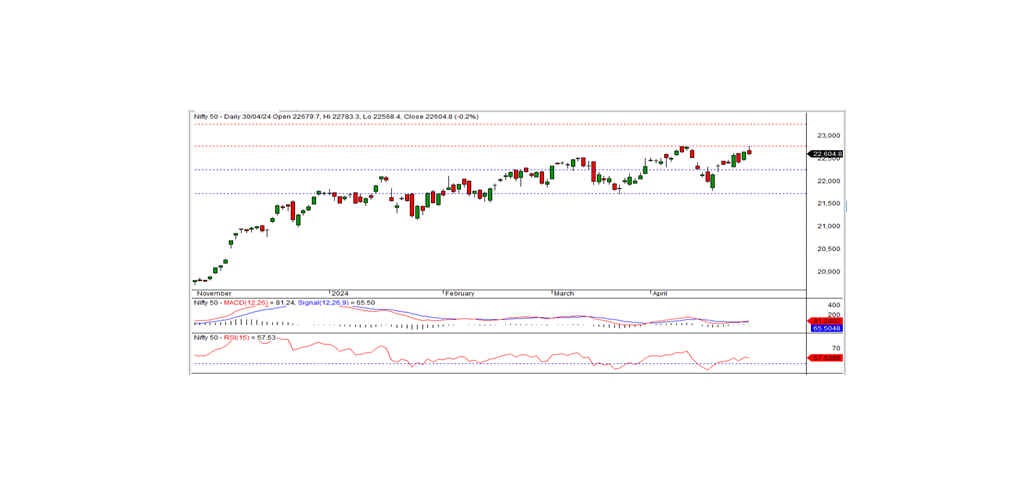
In the latest trading session, the Nifty concluded at 22,604.85, marking a decline of -38.55 points or -0.17 percent. The prevailing negative sentiment may persist if the Nifty continues to trade and maintain below the intraday support level of 22,550.
In the last trading session, the Nifty opened at 22,679.70 on a positive note, reaching the all-time peak of 22,783.30. However, in the closing session, the index retreated, hitting an intraday low of 22,568.40 before settling at 22,604.85. Notable sectoral gains were observed in auto, realty, PSU banks, and financial services, while IT, media, metal, and pharma sectors experienced significant losses. The market breadth depicted a negative trend, with 1,156 stocks rising, 1,322 falling, and 124 remaining unchanged. Prominent gainers within the Nifty were M&M, POWERGRID, SHRIRAMFIN, and INDUSINDBK, whereas notable losers included TECHM, BPCL, JSWSTEEL, and HCLTECH.
From a technical perspective, the Nifty maintains its position above both short-term and long-term moving averages. Momentum indicators suggest a positive trend. Nevertheless, the formation of a small black candle on the daily chart, coupled with a close near the day's low, indicates a slightly bearish inclination. The index has an intraday support of 22,550. A breach below this level could lead to a further downtrend. Conversely, the intraday resistance stands at 22,625 levels. To initiate a pullback rally, the index must surpass this threshold.
Intraday Levels: Support - 22,550, 22,450, 22,375 Resistance - 22,625, 22,700, 22,780 (15-Minute Charts)
Positional Trading: Short-term Support - 22,250-22,700 Resistance - 22,775-23,250
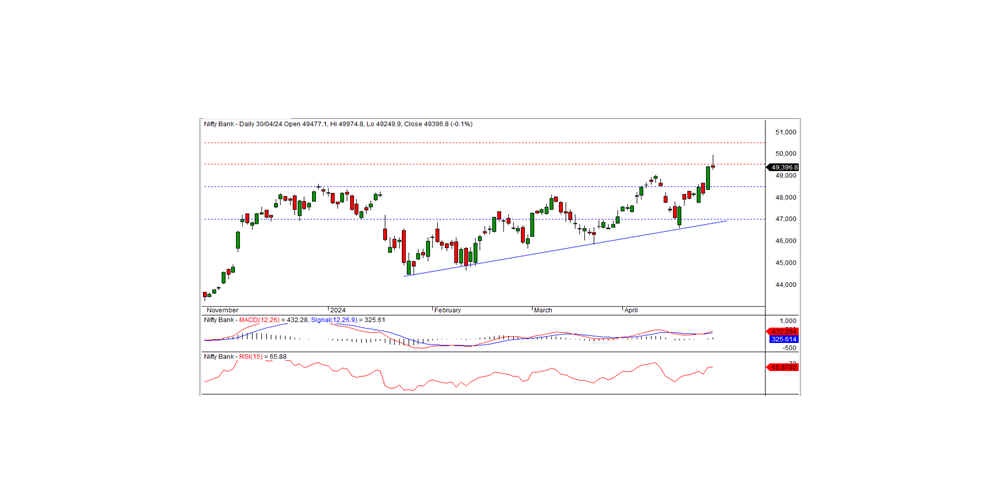
BANK NIFTY
In the previous trading session, Bank Nifty tested a record high of 49,974.80 but eventually closed at 49,396.80, marking a loss of -27.30 points. From a technical standpoint, momentum indicators signal a positive trend, with the index positioned above both short-term and long-term moving averages. However, the formation of a small black candle on the daily chart, closing just below the previous day's close, suggests the emergence of selling pressure near higher levels.
On the upper side, the index encounters short-term resistance at the 49,500 level. A close above this level could sustain the bullish trend in the coming days, while failure to do so may lead to consolidation below this threshold for a brief period.
For intraday traders, support levels are identified at 49,000, 48,675, and 48,350, whereas resistance levels can be observed at 48,375, 49,685, and 50,000, as per the 15-minute charts.
Positional traders are advised to monitor short-term support levels between 48,500-47,000, with resistance levels positioned at 49,500-50,500.