NIFTY TECHNICAL OUTLOOK
Based on Market Closing on Friday, May 10, 2024
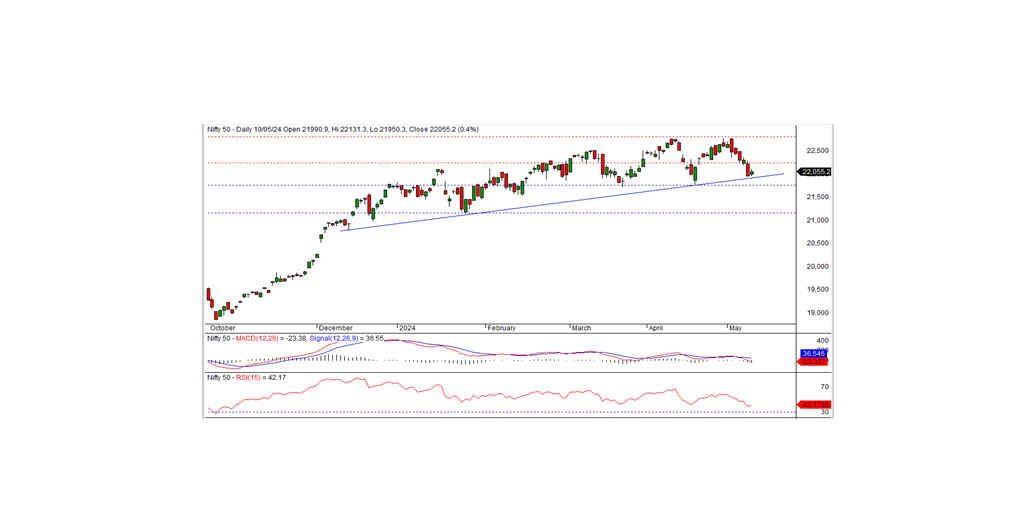
In the recent trading session, the Nifty concluded at 22055.20, marking a gain of 97.70 points or 0.44 percent. The upward momentum is expected to persist as long as the Nifty remains above the 21900 level.
Commencing at 21990.90, the Nifty started positively in the last session. After touching an intraday low of 21950.30 during morning trade, it steadily climbed, hitting an intraday peak of 22131.30 before settling at 22055.20. Key sectors that experienced gains were metal, FMCG, pharma, and auto. Market breadth leaned towards positivity, with 1460 stocks climbing, 1031 declining, and 112 remaining unchanged. Notable performers within the Nifty included BPCL, NTPC, POWERGRID, and HEROMOTOCO, while TCS, CIPLA, LTIM, and INFY were among the notable decliners.
From a technical perspective, the Nifty continues to trade below short-term moving averages, with momentum indicators signaling a negative trend. However, the index formed a small white candle on the daily chart and closed inside the previous day's candle. This candle looks like a bullish Harami pattern. This pattern indicates that the bearish trend is reversing. For confirmation, the coming day the index should trade and sustain above the Harami pattern high. Intraday support for the Nifty is observed at the 21985 level, with resistance at 22130. For a bullish trend, the index needs to surpass its previous day's high at 22130, while a continuation of the recent downtrend would require it to breach 21900.
Intraday Levels: Support - 21985, 21900, 21800 Resistance - 22130, 22230-22325 (15-Minute Charts)
Positional Trading: Short-term support - 21750-21150 Resistance - 22250-22800.

BANK NIFTY
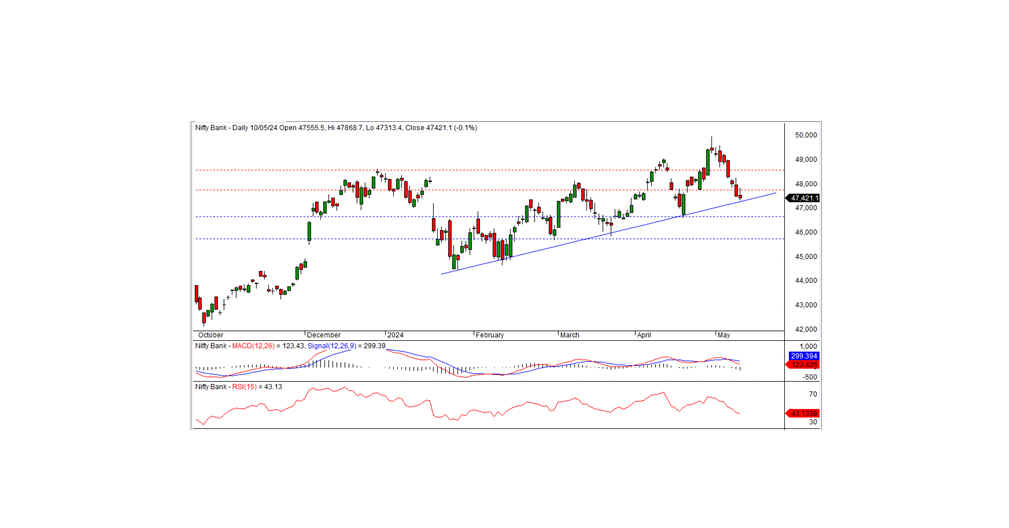
In the previous trading session, Bank Nifty concluded at 47421.10, marking a loss of -66.80 points. Technically, momentum indicators signal a negative trend, with the index persisting below short-term moving averages. Additionally, a black candle formed on the daily chart, closing below the previous day's level, indicating the potential continuation of the downtrend. The index finds trendline support at the 47250 level, and a close below this mark may sustain the downtrend in subsequent sessions. Conversely, if remains above the support a bounce-back rally could be anticipated from this level.
For intraday traders, support levels are noted at 47400, 47150, and 46900, while resistance levels are identifiable at 47700, 47950, and 48200, as suggested by the 15-minute charts.
Positional traders are advised to monitor short-term support levels at 46650-45700, with resistance observed at 47750-48500.

