NIFTY Technical Outlook
Market Closing Analysis for Wednesday, August 14, 2024
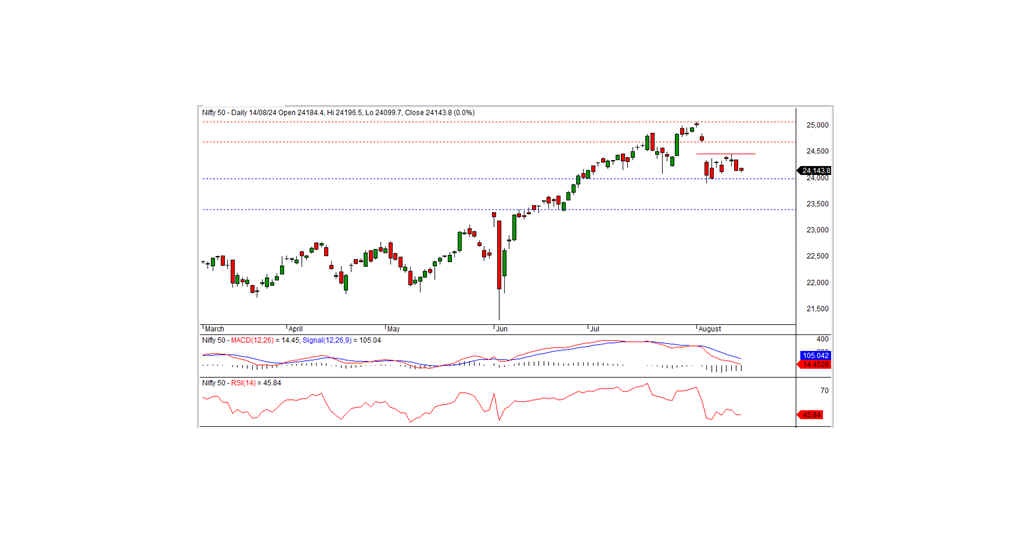
On Wednesday, August 14, 2024, the Nifty closed at 24,143.75, gaining a modest 4.75 points or 0.02%. The index needs to maintain levels above 24,100.00 to sustain its current uptrend.
The session began on a positive note, with the Nifty opening at 24,184.40 and reaching a high of 24,196.50 in the morning. However, it faced selling pressure, dipping to an intraday low of 24,099.70 before recovering slightly by the close. The market saw broad-based weakness, with all sectors except IT and Auto closing in the red. Notably, the Metals, Media, Pharma, and Realty sectors were the biggest losers. Market breadth was negative, as 1,720 stocks declined compared to 850 advancers, while 101 remained unchanged. The top performers in the Nifty index were TCS, HCLTECH, INFY, and TECHM, whereas DIVISLAB, HEROMOTOCO, COALINDIA, and ULTRACEMCO were among the major losers.
From a technical perspective, momentum indicators are reflecting a negative trend, and the Nifty remains below its short-term moving averages. The index formed a black candle on the daily chart, closing just above the previous day's level, which suggests potential consolidation. Support for the index is seen at 24,100, with resistance at 24,200. A break above the 24,200 level could lead to a pullback rally, but for a strong positive trend, the index must close above 24,475. Conversely, a decline below 24,100 could signal a resumption of the recent downtrend.
Intraday support levels are at 24,100, 24,000, and 23,900, while resistance is at 24,200, with further barriers between 24,300 and 24,400.
For positional trading, key levels include short-term support at 24,000-23,400 and resistance at 24,685-25,080.
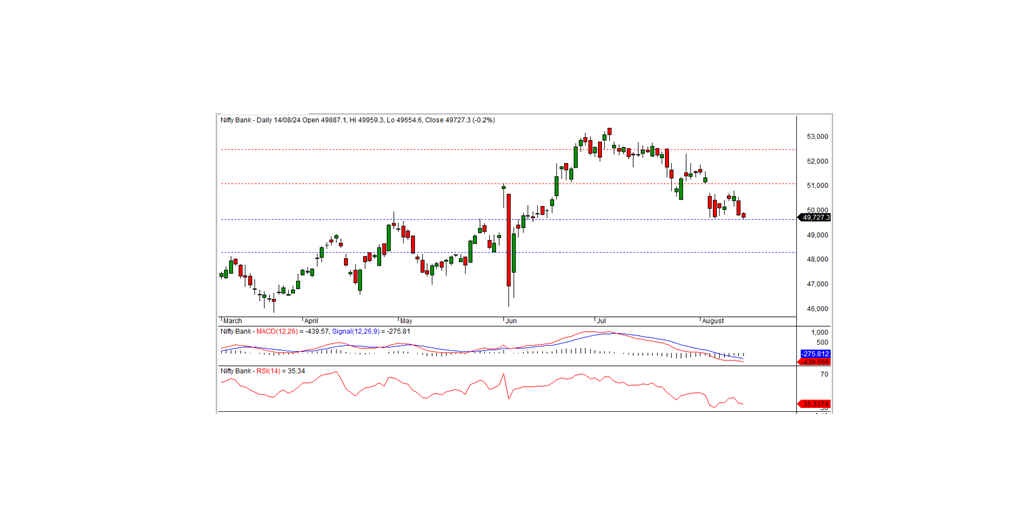
BANK NIFTY
In the previous trading session, Bank Nifty closed at 49,727.30, registering a loss of 104.55 points. From a technical standpoint, momentum indicators suggest a downward trend, with the index remaining below its short-term moving averages. Additionally, the index formed a black candle on the daily chart and closed near the day's low, indicating a potential continuation of the downtrend. On the downside, the index has short-term support at the 49,600 level. The RSI indicator is currently at 35, indicating that the index is in oversold territory. Historically, the index has rebounded whenever the RSI approached 30, hinting at a possible reversal. For a pullback rally to occur, the index must surpass the intraday resistance level of 49,900.
For intraday traders, support levels are at 49,600, 49,400, and 49,200, while resistance levels are identified at 49,900, 50,075, and 50,300, as indicated by the 15-minute charts.
Positional traders should monitor short-term support levels at 49,600-48,300, with resistance at 51,000-52,450.