Nifty Technical Outlook
Based on Market Closing on Monday, July 29, 2024
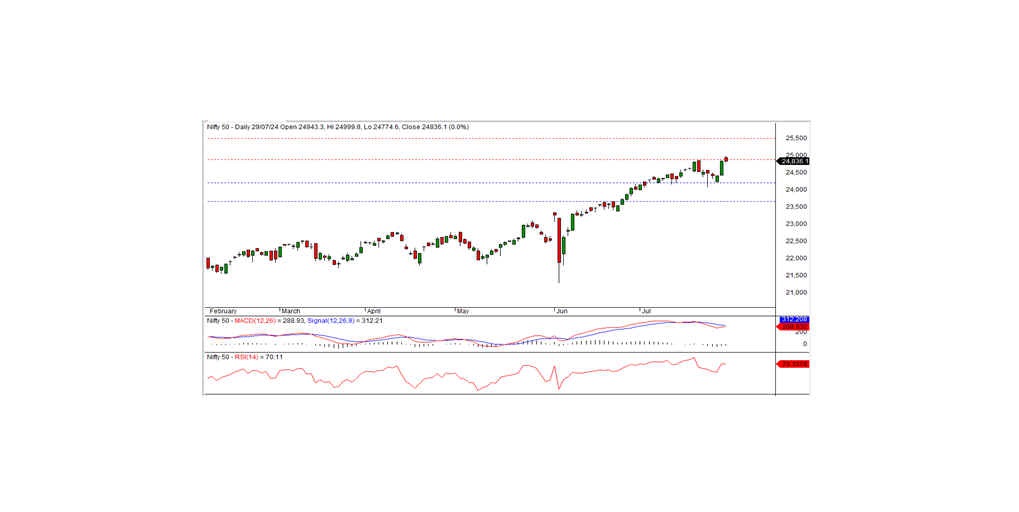
In the last trading session, the Nifty closed at 24,836.10, up 1.25 points or 0.01 percent. The bullish trend is expected to continue if the Nifty closes above the short-term resistance level of 24,870.
The session saw the Nifty open higher at 24,423.30 and reach a record high of 24,999.80. However, the index could not sustain its upward momentum and gradually moved down, hitting an intraday low of 24,764.60 before closing at 24,836.10. The biggest sector gainers were PSU banks, media, realty, and auto, while the losers included IT, FMCG, and Financial Services. The market breadth was positive, with 1,474 stocks rising, 1,090 falling, and 83 remaining unchanged. Top gainers in the Nifty index were DIVISLAB, BPCL, LT, and BAJAJFINSV, while the major losers included TITAN, BHARTIARTL, CIPLA, and ITC.
From a technical standpoint, momentum indicators signal a neutral trend. However, the Nifty remains above both the short-term and long-term moving averages. The index formed a small black candle on the daily chart but closed above the previous day's high. These factors indicate the possibility of continuing the bullish trend. On the higher side, the index has resistance at the 24,870 level. If the index closes above this level, the bullish trend may continue in the coming days. Otherwise, the index may consolidate below this level for a few days before resuming its uptrend. The nearest intraday support is at 24,800.
Intraday Levels: Support: 24,800, 24,700, 24,600 Resistance: 24,900, 25,000-25,100 (15-Minute Charts)
Positional Trading: Short-term Support: 24,200-23,650 Resistance: 24,870-25,500
Bank Nifty Outlook
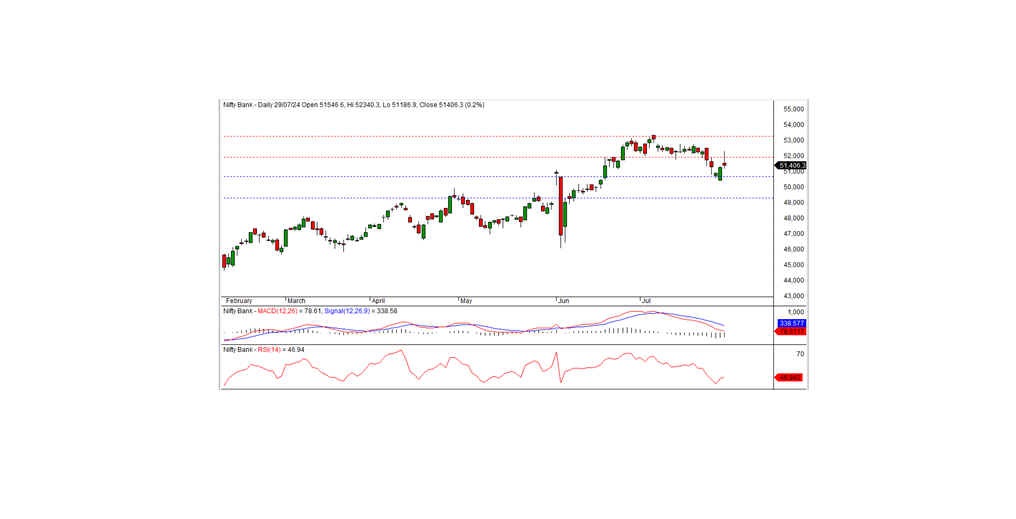
In the preceding trading session, Bank Nifty closed at 51,406.25, registering a gain of 110.30 points. Technically, momentum indicators signal a negative trend, and the index remains below the short-term moving averages. The index formed a small black candle on the daily chart and closed above the previous day's close. On the higher side, the index has intraday resistance at the 51,600 level. If the index moves above this level, bullish trends are likely to continue. Otherwise, the index may consolidate below this level for a few days. The nearest intraday support is at 51,200.
Intraday Levels: Support: 51,200, 50,900, 50,600 Resistance: 51,600, 51,950, 52,300 (15-Minute Charts)
Positional Trading: Short-term Support: 50,650-49,300 Resistance: 51,900-53,250