NIFTY Technical Analysis
As of Market Close on Monday, May 6, 2024
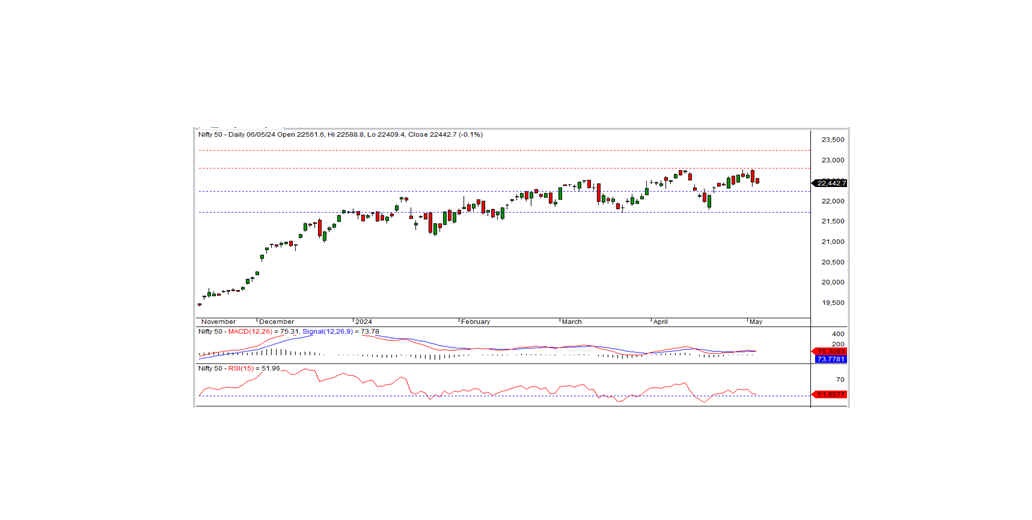
In the most recent trading session, the Nifty concluded at 22,442.70, experiencing a marginal decline of -33.15 points or -0.15 percent. The prevailing downward trajectory will likely persist if the Nifty remains below the intraday support level of 22,400.
Initiating positively, the Nifty opened at 22,561.60 and reached an intraday high of 22,588.80 during morning trading. However, the index gradually receded, touching an intraday low of 22,409.40 before settling at 22,442.70. Among the sectors, realty, IT, FMCG, and private banks have displayed notable gains, whereas PSU banks, media, metal, and financial services incurred losses. The market breadth leaned towards negativity, with 655 stocks on the rise, 1825 declining, and 122 remaining unchanged. Leading the gainers within the Nifty were BRITANNIA, KOTAKBANK, TCS, and HINDUNILVR, while notable losers encompassed TITAN, ASIANPAINT, BPCL, and COALINDIA.
From a technical perspective, the Nifty maintains its position above both medium-term and long-term moving averages. Momentum indicators advocate for a positive trend. However, the formation of a black candle on the daily chart, coupled with closure below the previous day's close, hints at a slightly pessimistic sentiment. In terms of support, the 22,400-22,350 range serves as the intraday support for the index. A breach below this zone could prolong the ongoing downtrend. Conversely, intraday resistance is anticipated around the 22,550 level. To trigger a rebound, the index must surpass this threshold.
Intraday Levels: Support - 22,400, 22,300, 22,225 Resistance - 22,550, 22,650-22,750 (Based on 15-Minute Charts)
Positional Trading: Short-term Support - 22,250-21,700 Resistance - 22,800-23,250
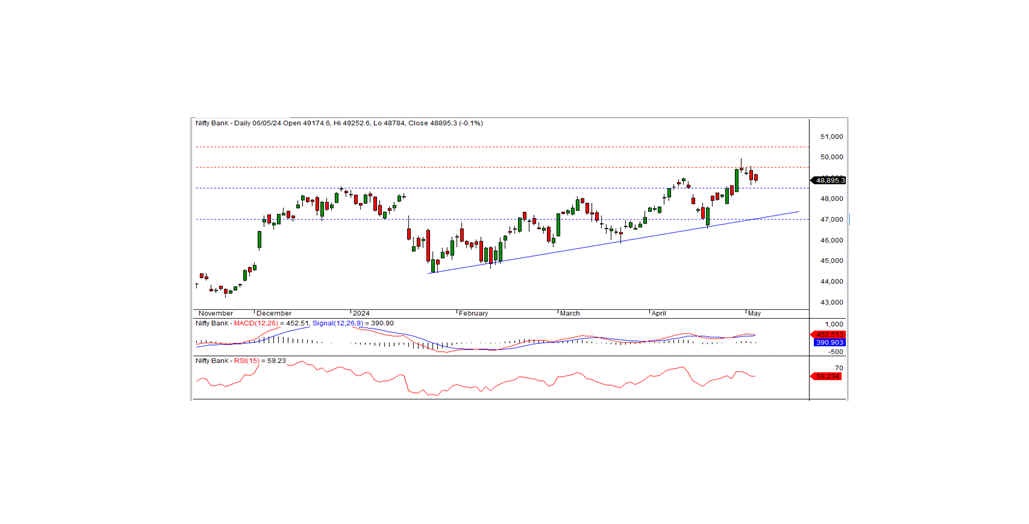
BANK NIFTY Analysis
In the latest trading session, Bank Nifty concluded at 48,895.30, marking a minor downturn of -28.25 points. From a technical standpoint, momentum indicators continue to signal a positive trajectory, with the index maintaining its position above both medium-term and long-term moving averages. However, the formation of a black candle on the daily chart, coupled with closure below the previous day's level, suggests a slight negative inclination.
On the downside, the index finds intraday support around the 48,700 mark. A breach below this level could continue the ongoing downtrend. Conversely, the closest intraday resistance is anticipated around the 49,200 level. To initiate a rebound, the index must surpass this threshold.
For intraday traders, key support levels are identified at 48,700, 48,400, and 48,100, while resistance levels are observed at 49,200, 49,600, and 49,950, as indicated by the 15-minute charts.
Positional traders are advised to monitor short-term support levels between 48,500 and 47,000, with resistance levels identified at 49,500 to 50,500.