Falling wedge pattern
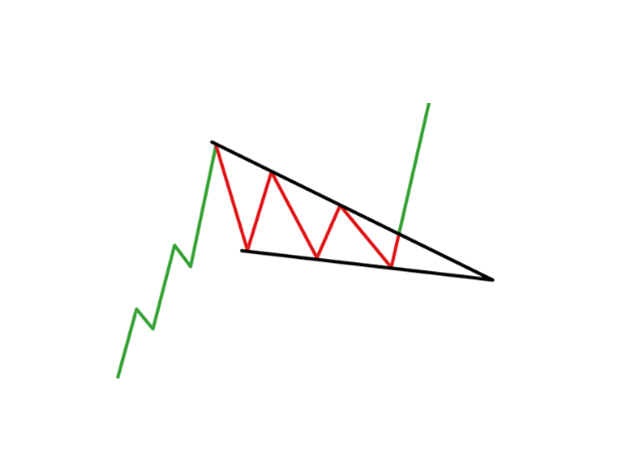
A falling wedge is a chart pattern in technical analysis that is formed by drawing two downward-sloping trend lines that connect a series of lower lows and higher highs. This pattern is considered a bullish pattern, as it typically signals that a stock or asset is likely to see a price increase.
In a falling wedge pattern, the two downward-sloping trend lines represent support levels, and the price of the stock or asset is becoming increasingly constricted between these levels. If the price of the stock or asset breaks out above the upper trend line, it is usually considered a signal to buy, as the price is likely to continue to increase.
When trading with a falling wedge pattern, it's important to look for confirmation of the pattern from other technical indicators, such as volume and momentum indicators. Additionally, it's a good idea to consider other factors, such as market conditions and overall market trends, before making a trade based on the pattern.
As with any technical analysis tool, it's important to remember that chart patterns should not be relied upon solely when making investment decisions. It's always a good idea to consider other factors, such as fundamental analysis and market conditions, before making a trade based on a chart pattern.