Dragonfly Doji candlestick Pattern
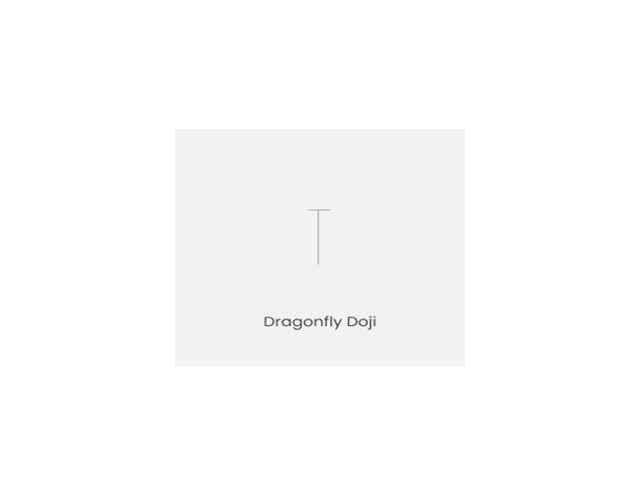
The Dragonfly Doji is a bullish reversal candlestick pattern that forms when the opening price, closing price, and low price of an asset are all at the same level. It has a long lower shadow and little to no upper shadow.
The pattern is called a "dragonfly" because it resembles the shape of a dragonfly with a long lower shadow and no upper shadow. This indicates that the sellers pushed the price down during the trading session but the buyers came back and pushed the price back up to its opening level or even higher, creating a bullish sentiment.
The Dragonfly Doji pattern suggests a possible trend reversal from a bearish to a bullish trend. It is considered more significant when it appears after a downtrend or a pullback in an uptrend. Traders often use it as a signal to buy the asset, expecting it to move higher.
However, it is important to consider other factors and indicators before making a trading decision based solely on the Dragonfly Doji pattern. The pattern can also be unreliable if it occurs during a period of low trading volume or if it appears frequently on a chart.

