NIFTY TECHNICAL OUTLOOK
Based on Market Closing on Friday, January 19, 2024
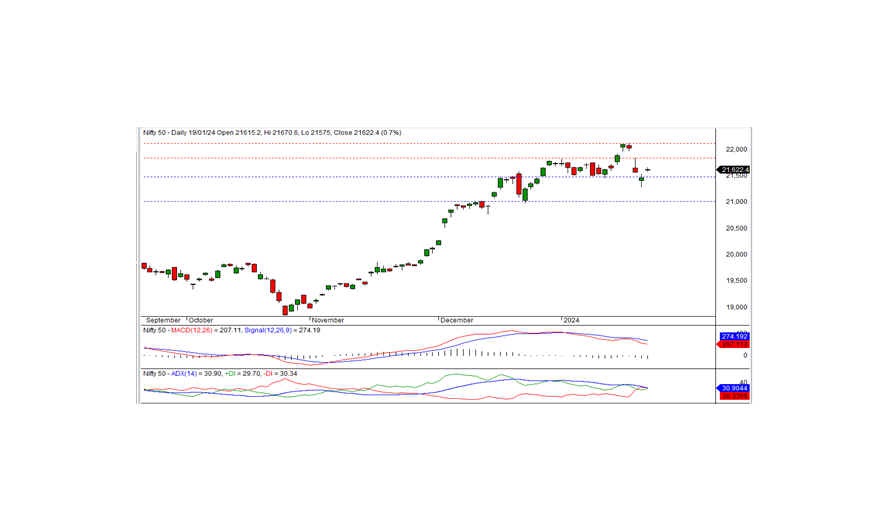
In the last trading session, the Nifty closed at 21,622.40, marking an increase of 160.15 points or 0.75 percent. To sustain the uptrend, the Nifty needs to remain above the 21,500 level.
Opening at the 21,615.20 level on a positive note, the Nifty tested the intraday high of 21,670.60. Subsequently, the index moved in a sideways manner and finally closed at 21,622.40. The metal, FMCG, PSU bank, and auto sectors were the major gainers, while the media and banks were among the losers. The market breadth was positive, with 1,549 stocks rising, 843 falling, and 126 remaining unchanged. Under the Nifty, ONGC, BHARTIARTL, NTPC, and TECHM emerged as the top gainers, while the major losers were INDUSINDBK, HDFCBANK, KOTAKBANK, and DIVISLAB.
From a technical standpoint, the Nifty remains below the short-term moving averages, with momentum indicators signaling a negative trend. The index formed a Doji candle on the daily chart and closed above the previous day's close. On the lower side, the index has short-term support at 21,500. If the index remains above this level, the positive trend can continue in the coming days. The nearest intraday resistance is at 21,660 levels.
Intraday Support Levels: 21,570 - 21,475 - 21,400 Resistance Levels: 21,660 - 21,765 - 21,850 (15-Minute Charts)
For positional traders, short-term support levels remain at 21,500 - 21,000, with resistance at 21,835 - 21,125.

BANK NIFTY
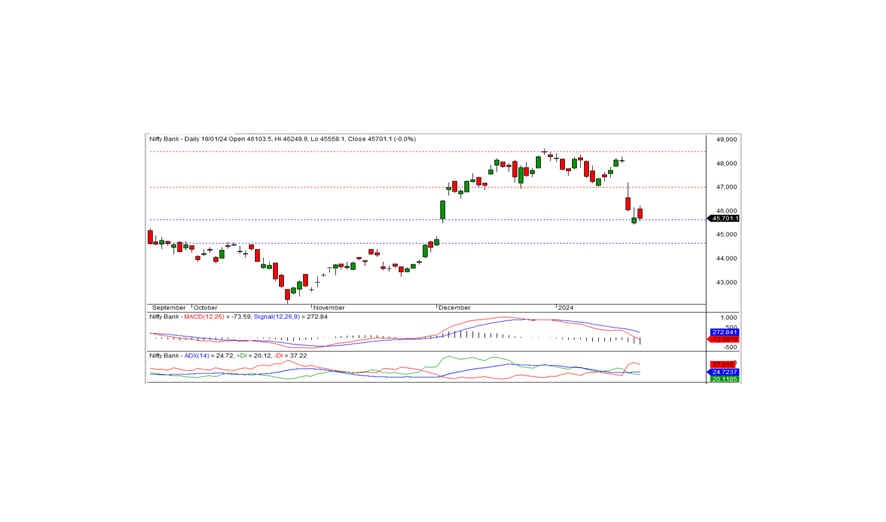
In the preceding trading session, Bank Nifty closed at 45,701.15, registering a marginal loss of -12.40 points. From a technical perspective, the momentum indicators signal a negative trend, and the index remains positioned below both short-term and medium-term moving averages. Additionally, the index formed a black candle on the daily chart and closed just below the previous day's close. On the lower side, the index has short-term support at the 45,600 level. If the index closes below this level, the negative trend may continue in the coming days. The nearest intraday resistance is at 45,900 levels. For a positive trend, the index needs to surpass this level.
For intraday traders, the support levels are identified at 45,500, 45,150, and 45,850, while resistance levels can be observed at 45,900, 46,200, and 46,500, as indicated by the 15-minute charts.
Positional traders are advised to monitor short-term support levels at 45,600-44,650, with resistance at 47,000 - 48,500.

