NIFTY TECHNICAL UPDATE
As of the market closing on Wednesday, January 3, 2024.
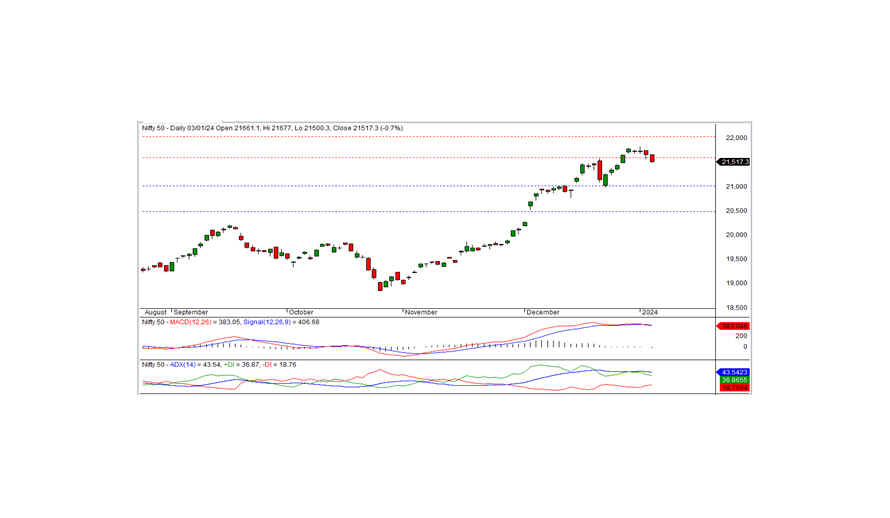
The Nifty concluded the trading session at 21517.35, registering a loss of -148.45 points or -0.69 percent. The downward bias may persist if the Nifty remains below 21600.00.
Commencing at the 21661.10 level on a negative note, the Nifty maintained this trend throughout the session, reaching an intraday low of 21500.30 before settling at 21517.35. Top-performing sectors included realty, PSU banks, pharma, and media, while IT, metal, financial services, and auto saw the most significant losses. Market breadth remained positive, with 1250 stocks advancing, 1119 declining, and 140 holding steady. Leading gainers under the Nifty umbrella were BAJAJ-AUTO, ADANIENT, INDUSINDBK, and ITC, with major losers being HINDALCO, JSWSTEEL, TATA STEEL, and LTIM.
From a technical standpoint, the Nifty closed below its short-term moving averages, and momentum indicators signal a neutral trend. Furthermore, the index formed a small black candle on the daily chart, closing below the previous day's close, indicating a negative bias. The index's short-term support rests at 21500 levels, and a breach of this level may result in further downward movement. The nearest short-term resistance is at 21600 levels.
For intraday trading, support levels are situated at 21500-21425-21350, with resistance levels at 21600-21675-21750 (15-minute charts). Positional traders should take note of short-term support at 21000-20500, coupled with resistance at 21600-22000.

BANK NIFTY UPDATE
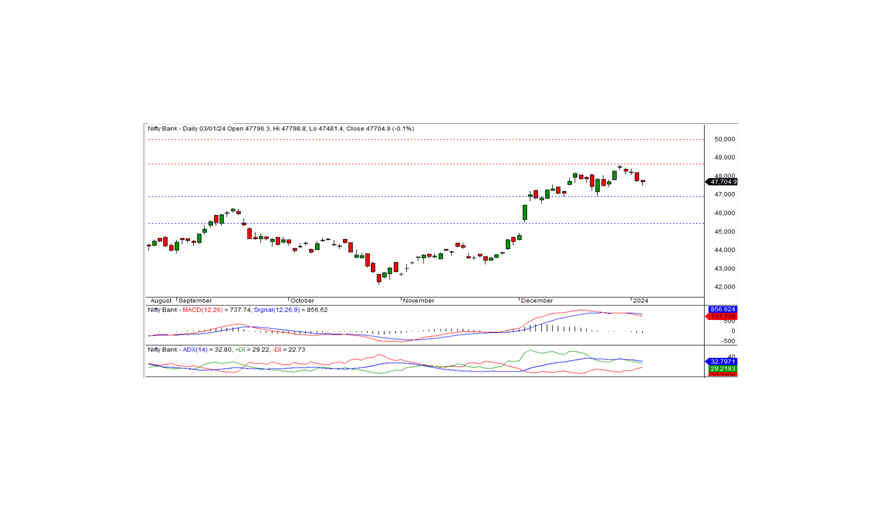
In the recent trading session, Bank Nifty concluded at 47704.95, reflecting a loss of -56.70 points. From a technical standpoint, momentum indicators suggest a neutral trend, and the index remains below the short-term moving averages. Additionally, a black candle on the daily chart, closing below the previous day's close, indicates a negative trend. On the downside, the index has intraday support at 47600, and if it breaches, the negative trend may persist. The closest intraday resistance is identified at the 47800 level.
For intraday traders, support levels are noted at 47600, 47400, and 47200, while resistance levels can be observed at 47800, 48000, and 48200, as depicted in the 15-minute charts.
Positional traders are advised to monitor short-term support levels at 47000-45500, with resistance identified at 48650 - 50000.

