NIFTY TECHNICAL OUTLOOK
Based on Market Closing on Tuesday, July 23, 2024
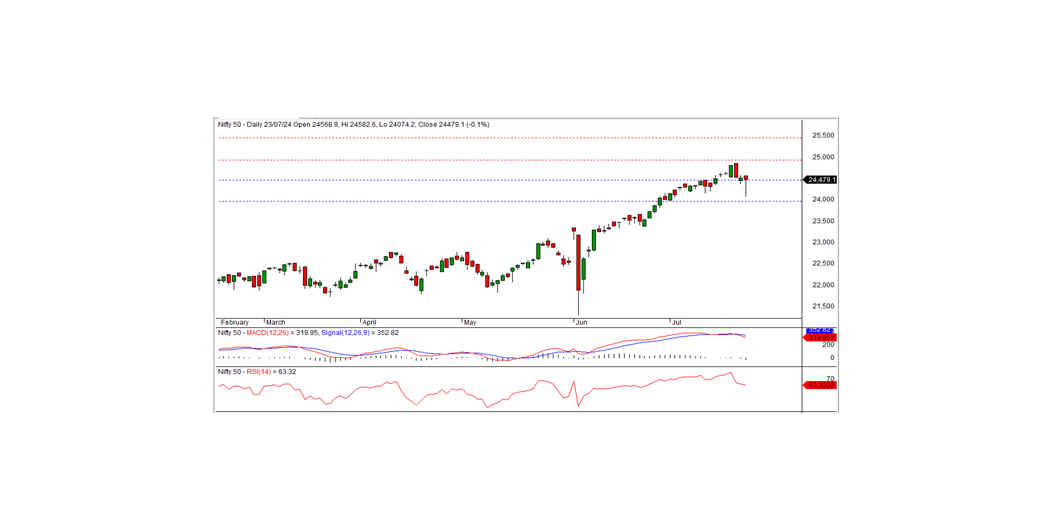
In the last trading session, the Nifty closed at 24,479.05, down 30.20 points or 0.12 percent. The downtrend will continue if the index remains below the short-term support level of 24,500.
The Nifty opened at 24,568.90 with a positive bias and reached an intraday high of 24,582.60 during the morning trade. However, the index fell sharply, hitting an intraday low of 24,074.20. The index recovered from the low in the afternoon and finally closed at 24,479.05. FMCG, media, IT, and pharma were the top gainers, while realty, banks, and metal were the major losers. The market breadth was negative, with 1,052 stocks rising, 1,505 falling, and 87 remaining unchanged. The top gainers in the Nifty index were TITAN, ITC, TATACONSUM, and ADANIPORTS. On the other hand, the major losers included SHRIRAMFIN, LT, HINDALCO, and BAJFINANCE.
From a technical standpoint, momentum indicators signal a neutral trend. The Nifty closed below the short-term moving averages and formed a small black candle on the daily chart, closing below the previous day's close. The long lower shadow of the candle indicates buying interest near the support area. The nearest intraday support is at 24,450 levels, while resistance is at 24,600. For a positive trend, the index must trade and sustain above the 24,600 level. Otherwise, the index may consolidate below this level for a few days.
Intraday Levels: Support: 24,450, 24,350, 24,250 Resistance: 24,600, 24,700-24,800 (15-Minute Charts)
Positional Trading: Short-term support: 24,500-24,000 Resistance: 25,000-25,500
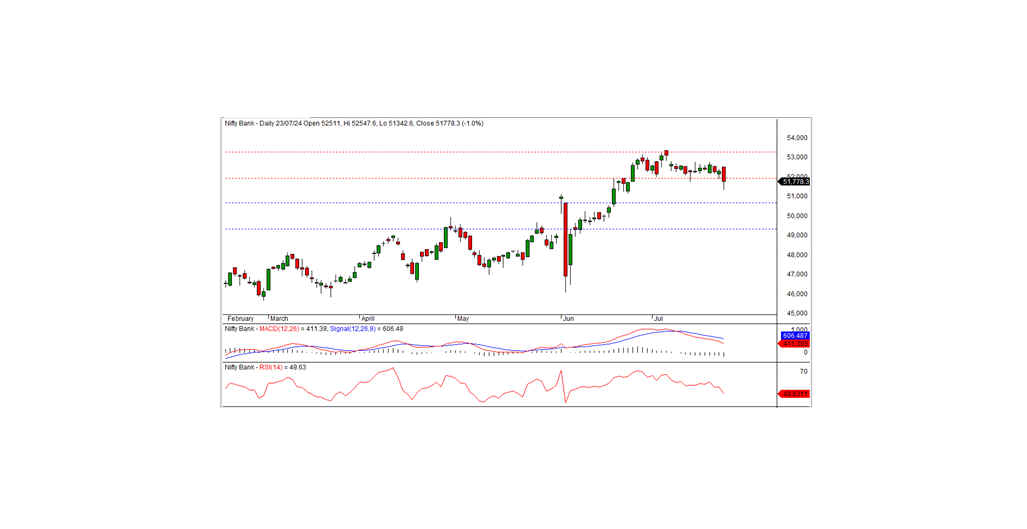
BANK NIFTY
In the preceding trading session, Bank Nifty closed at 51,778.30, registering a loss of 502.10 points. Technically, the momentum indicators signal a negative trend as the index remains below the short-term moving averages. Additionally, the index formed a black candle on the daily chart and closed below the short-term support level of 51,900. This pattern indicates a negative bias for the index. A further downtrend can be expected if the index remains below this level, with the nearest short-term support at 50,650 levels. On the higher side, the index has intraday resistance at 51,900. For a pullback rally, the index needs to move above this level.
Intraday Levels: Support: 51,600, 51,350, 51,150 Resistance: 51,900, 52,150, 52,400 (15-Minute Charts)
Positional Trading: Short-term support: 50,650-49,300 Resistance: 51,900-53,250