
NIFTY TECHNICAL OUTLOOK
Based on Market Closing on Friday, August 02, 2024
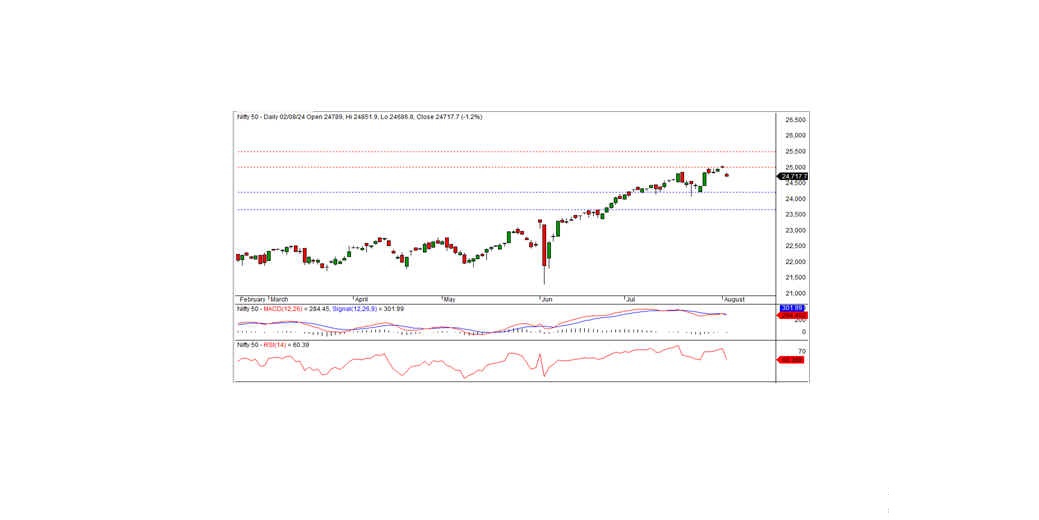
In the last trading session, the Nifty closed at 24,717.70, down by 293.20 points or 1.17 percent. The downtrend will continue today if the Nifty remains below the intraday resistance level of 24,750.
On the previous trading day, the Nifty opened with a downward gap at 24,789, continuing a negative trend and hitting an intraday low of 24,686.80 before closing at 24,717.70. All sectors except Pharma closed with a negative bias. The biggest sector losers were Realty, Auto, Metal, and IT. The market breadth was negative, with 968 stocks rising, 1,583 falling, and 105 remaining unchanged. The top gainers in the Nifty index were DIVISLAB, HDFCBANK, DR REDDY, and SUN PHARMA, while the major losers included EICHERMOT, MARUTI, TATAMOTORS, and HINDALCO.
From a technical standpoint, momentum indicators signal a neutral trend. However, the Nifty closed below its short-term moving averages and formed a small black candle on the daily chart, closing well below the previous day's close. These indicators suggest the possibility of a continuing downtrend. On the higher side, the index faces intraday resistance at the 24,750 level. If the index remains below this level, the downtrend will likely persist in the coming days. The nearest short-term support is at 24,200.
Intraday Levels: Support: 24,650, 24,550, 24,450 Resistance: 24,750, 24,850-24,950 (15-Minute Charts)
Positional Trading: Short-term Support: 24,200-23,650 Resistance: 25,000-25,500
BANK NIFTY TECHNICAL OUTLOOK
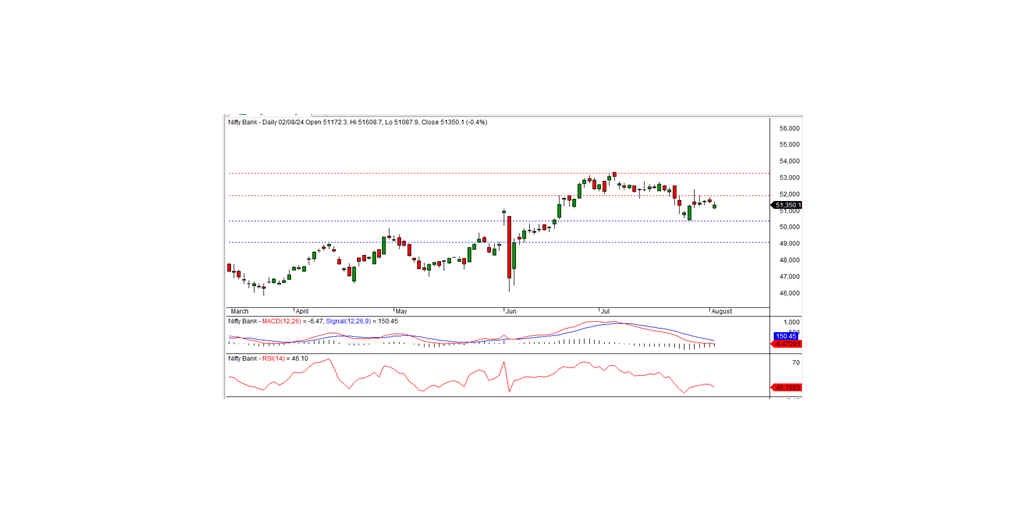
In the preceding trading session, Bank Nifty closed at 51,350.15, registering a loss of 213.85 points. From a technical standpoint, momentum indicators suggest a downward trend, and the index closed below its short-term moving averages. Although the index formed a small white candle on the daily chart, it still closed below the previous day's close.
On the lower side, the index has intraday support at the 51,250 level. If the index moves below this level, the downtrend is likely to continue. The nearest intraday resistance is at the 51,600 level. For a bullish trend to develop, the index must trade and sustain above this resistance level. The short-term support remains at the 50,450 level.
Intraday Levels: Support: 51,250, 51,000, 50,750 Resistance: 51,600, 51,875, 52,200 (15-Minute Charts)
Positional Trading: Short-term Support: 50,400-49,000 Resistance: 51,900-53,250
World Markets
In the last trading session, the US and European markets closed significantly in the red. This morning, the Asian markets also opened with a negative bias, and the SGX Nifty was in the red during morning trade. Following the global trend, the Indian market also opened with a negative bias.