NIFTY TECHNICAL UPDATE
Based on Market Closing on Thursday, April 18, 2024
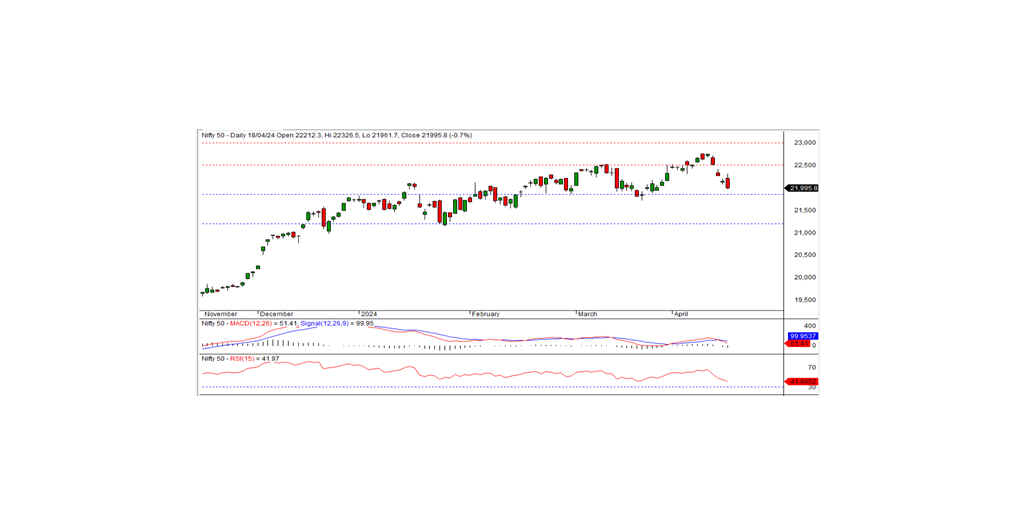
In the latest trading session, the Nifty closed at 21995.85, marking a decrease of -152.05 points or -0.69 percent. The downtrend is likely to persist if the Nifty continues to trade and maintain levels below the intraday resistance threshold of 22100.
During Thursday's trading session, the Nifty commenced at 22212.30, displaying early positive momentum and reaching an intraday high of 22326.50. However, the afternoon saw a reversal as the Nifty plummeted to an intraday low of 21961.70 before concluding the session at 21995.85. Most sectors ended on a negative note, with exceptions seen only in the media sector. Notable sectors experiencing losses were FMCG, financial services, private banks, and pharma. Market breadth skewed negative, with 1088 stocks advancing, 1344 declining, and 163 remaining unchanged. Top performers within the Nifty included BHARTIARTL, POWERGRID, BAJAJ-AUTO, and LTIM, whereas notable underperformers were APOLLOHOSP, TITAN, NESTLEIND, and COALINDIA.
From a technical perspective, the Nifty continues to hover beneath both short-term and medium-term moving averages, with momentum indicators signaling a bearish trend. A black candle formation on the daily chart, coupled with a close near the day's low, suggests the likelihood of sustained downward movement. Intraday resistance persists at 22100, and remains below this level could extend the downtrend. The next immediate support is anticipated at the 21850 level.
Intraday Levels: Support - 21960, 21850, 21750 Resistance - 22100, 22200, 22300 (15-Minute Charts)
Positional Trading: Short-term support - 21850-21200 Resistance - 22500-23000
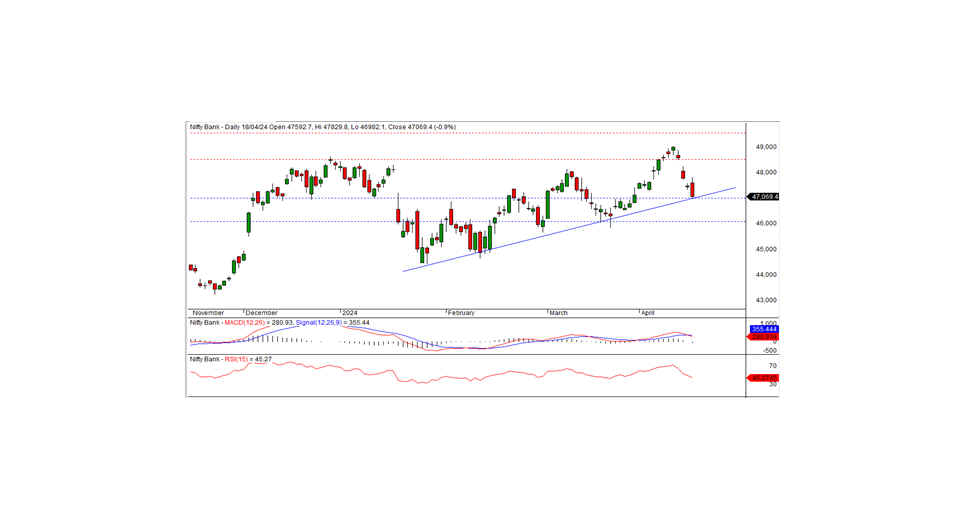
BANK NIFTY UPDATE
In the previous trading session, Bank Nifty concluded at 47069.45, marking a loss of -415.35 points. Technically, momentum indicators suggest a negative trend, with the index persisting below short-term moving averages. Additionally, a black candle formation on the daily chart and a close near the short-term support of 47000, indicates a continuation of the downtrend. If the index moves below this mark, the downtrend will also continue in the coming days. The subsequent short-term support is anticipated at the 46000 level, while the closest intraday resistance is observed at 47300. A break above this level is crucial for initiating a pullback rally.
For intraday traders, key support levels are identified at 47000, 46700, and 46400, while resistance levels can be pinpointed at 47300, 47600, and 47800 as per the 15-minute charts.
Positional traders are advised to monitor short-term support levels between 47000-46000, with resistance expected at 48500-49500.