NIFTY TECHNICAL OUTLOOK
Based on Market Closing on Tuesday, May 07, 2024
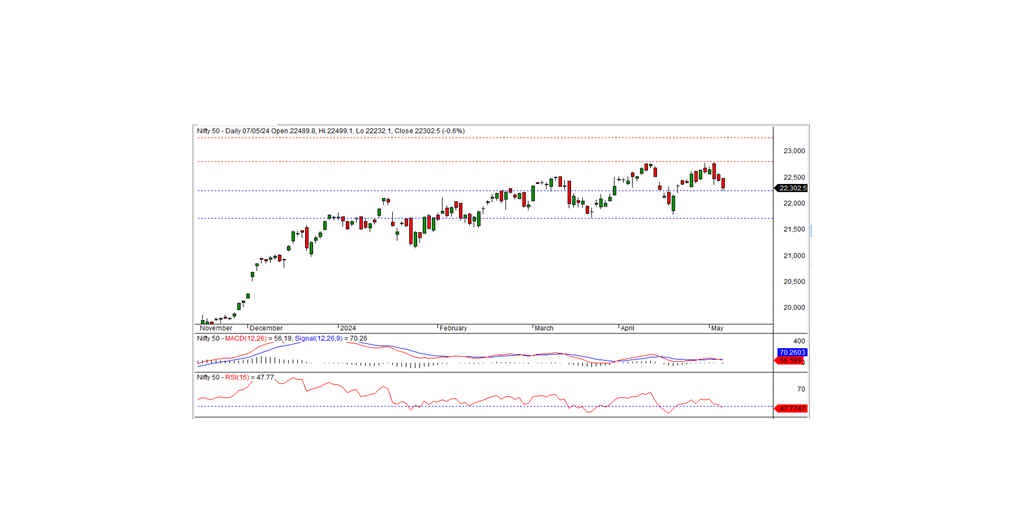
In the latest trading session, the Nifty concluded at 22302.50, marking a decline of -140.20 points or -0.62 percent. Should the Nifty persist below the immediate short-term support level of 22250, the bearish trend may persist.
The Nifty commenced the session positively at the level of 22489.80 and reached an intraday peak of 22499.10 in morning trading. Subsequently, it gradually retreated, touching an intraday low of 22232.10 before settling at 22302.50. With the exception of FMCG and IT, all sectors exhibited a negative sentiment. Real estate, metal, public banks, and pharmaceuticals were among the major decliners. The market breadth skewed negative, with 527 stocks witnessing gains, 1954 experiencing losses, and 122 remaining unchanged. Notable gainers within the Nifty were HINDUNILVR, TECHM, BRITANNIA, and NESTLEIND, while key losers included BAJAJ-AUTO, POWERGRID, ONGC, and INDUSINDBK.
Technically, the Nifty concluded below its short-term moving averages. Momentum indicators suggest a neutral trend. Furthermore, the index formed a black candle on the daily chart, closing beneath the prior day's close, indicating a bearish sentiment. The Nifty's short-term support lies around the 22500 mark; breaching this level could extend the downtrend. On the upside, intraday resistance is anticipated around 22330. A surpassing of this level is crucial for any potential pullback rally.
Intraday Levels: Support - 22230, 22150, 22075 Resistance - 22330, 22425-22525 (15-Minute Charts)
Positional Trading: Short-term support - 22250-21700 Resistance - 22800- 23250.

BANK NIFTY
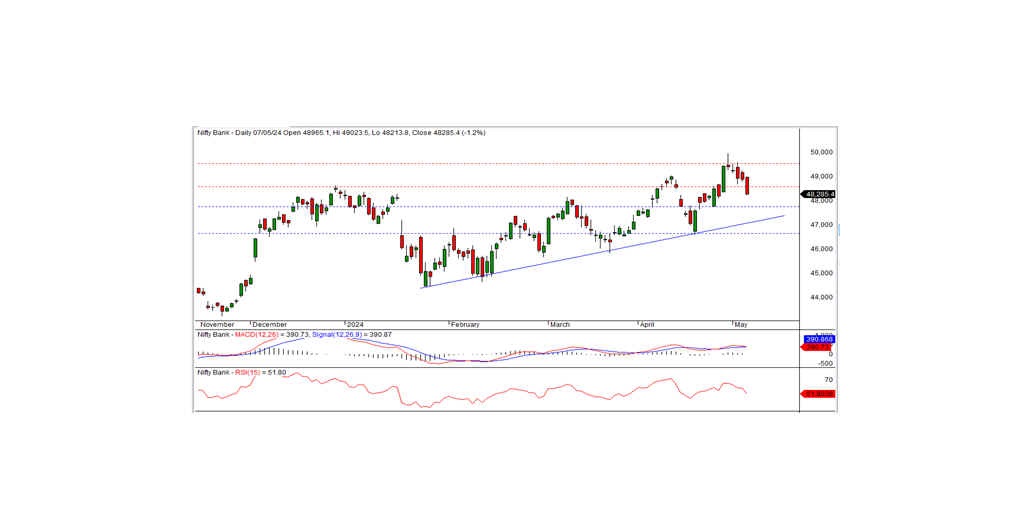
In the previous trading session, Bank Nifty concluded at 48285.35, marking a decline of -609.95 points. From a technical perspective, momentum indicators are signaling a negative trend, with the index closing below its short-term moving averages. Additionally, the formation of a black candle on the daily chart, coupled with closing below the previous day's close, suggests a potential continuation of the downtrend.
On the downside, the index finds intraday support around the 48200 level. A breach below this level could extend the downtrend for the day. The nearest intraday resistance is identified at the 48460 level; surpassing this level is crucial for any potential pullback rally.
For intraday traders, support levels are observed at 48200, 47900, and 47650, while resistance levels are at 48460, 48730, and 49000, as indicated by the 15-minute charts.
Positional traders should keep an eye on short-term support levels at 47750-46650, with resistance noted at 48500-49500.

