NIFTY TECHNICAL OUTLOOK
Based on Market Closing on Monday, February 26, 2024
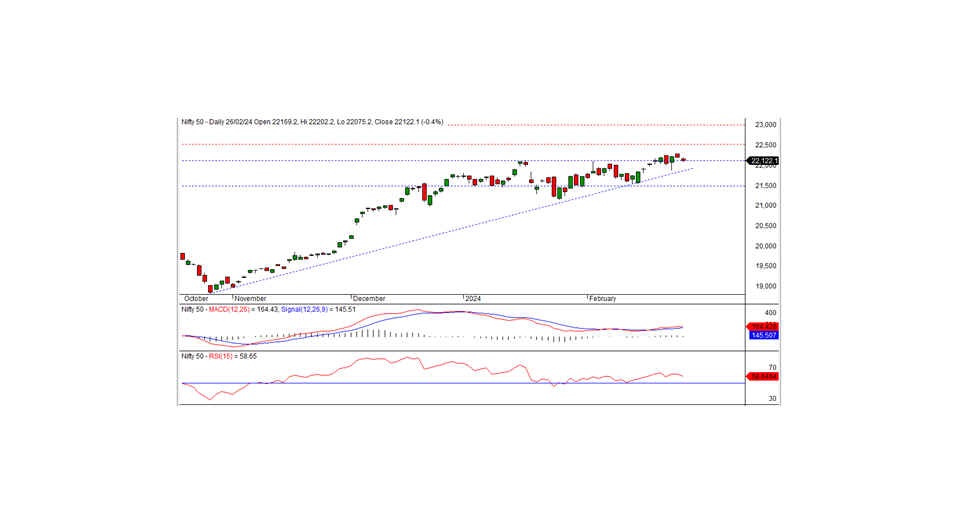
During the recent trading session, the Nifty concluded at 22122.05, experiencing a decrease of -90.65 points or -0.41 percent. Should the Nifty fall below 22100, further downward movement may occur.
Opening at 22169.20 in the last session, the Nifty commenced negatively and reached an intraday low of 22075.20 during morning trade. The index then traded sideways before settling at 22122.05 points. Auto and realty sectors closed positively, while IT, metal, banks, and pharma sectors experienced significant losses. Market breadth leaned negative, with 958 stocks rising, 1443 falling, and 142 remaining unchanged. Noteworthy gainers beneath the Nifty included LT, POWERGRID, ADANIENT, and BPCL, while major losers encompassed ASIANPAINT, APOLLOHOSP, HINDALCO, and DIVISLAB.
Technically, the Nifty remains above both short-term and long-term moving averages, with momentum indicators signaling a positive trend. However, the formation of a black candle on the daily chart and a close below the previous day's candle suggests a negative bias. The nearest intraday support is situated at 22100 levels, potentially indicating a continuation of the downtrend if breached. On the upside, intraday resistance is noted at 22175 levels, potentially paving the way for a pullback rally if the index trades and sustains above this threshold.
Intraday Support levels: 22100-22015-21950 Resistance levels: 22175-22250-22300 (15 Minute Charts)
For positional traders, short-term support levels stand at 22125-21500, while resistance levels are positioned at 22500-23000.
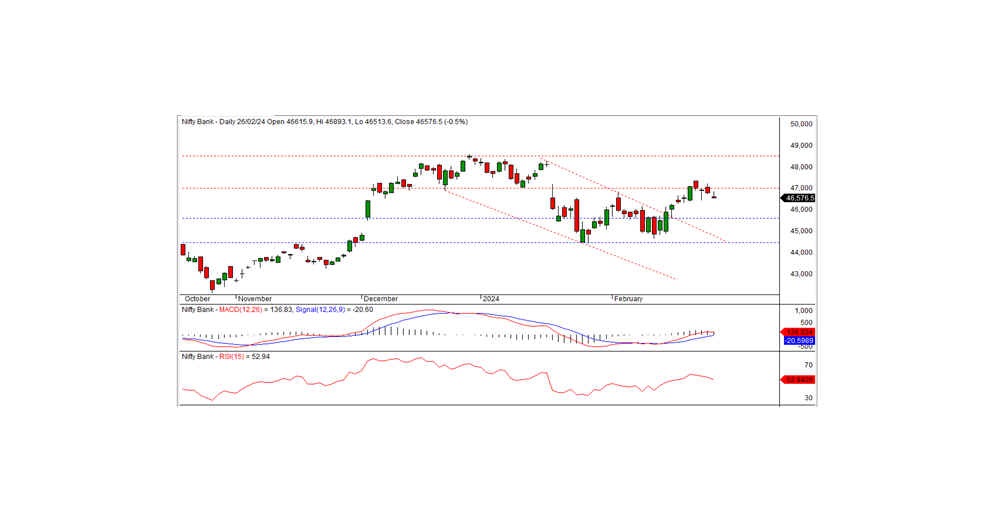
BANK NIFTY
In the previous trading session, Bank Nifty concluded at 46576.50, marking a loss of -235.25 points. From a technical perspective, momentum indicators signal a positive trend, with the index maintaining its position above both short-term and long-term moving averages. However, the formation of a black candle on the daily chart, along with a close below the previous day's close, suggests a negative bias. Intraday support for the index is observed at 46500, and a breach of this level could sustain the downward trend. Conversely, short-term resistance is noted at 46800, which must be surpassed for a potential pullback rally.
For intraday traders, support levels are identified at 46500, 46300, and 46100, while resistance levels are situated at 46800, 47000, and 47200, as indicated by the 15-minute charts.
Positional traders are advised to monitor short-term support levels at 45600-44500, with resistance at 47000-48500.