
NIFTY TECHNICAL ANALYSIS
Based on Market Closing on Wednesday, February 28, 2024
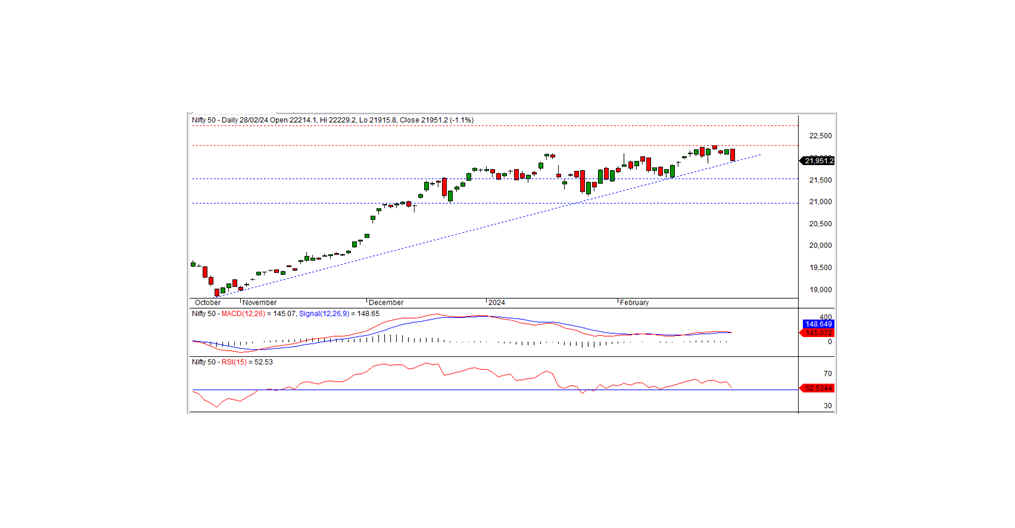
In the last trading session, the Nifty concluded at 21951.15, marking a decline of 247.20 points or -1.11 percent. The downtrend may persist if the Nifty falls below the 21925 level.
The trading day commenced positively with the Nifty opening at the 22214.10 level and reaching an intraday high of 22229.20 in morning trade. However, the index saw a downturn, touching an intraday low of 21915.80 before closing at 21915.15. All sectors closed with a negative bias, notably media, PSU banks, realty, and auto emerging as the biggest losers. Market breadth leaned negative with 436 stocks rising, 2002 falling, and 109 remaining unchanged. HINDUNILVR, INFY, TCS, and BHARTIARTL led the gainers, while POWERGRID, APOLLOHOSP, EICHERMOT, and BAJAJ-AUTO were among the major losers.
From a technical perspective, the Nifty closed below short-term moving averages, with momentum indicators signaling a neutral trend. The formation of a long black candle on the daily chart and close near the day's low suggests a negative bias. The nearest intraday support rests at 21925 levels, and a breach below could sustain the negative trend in subsequent days. Conversely, the Nifty faces intraday resistance at 22050 levels.
Technical Levels: Intraday Support Levels: 21925-21850-21775 Intraday Resistance Levels: 22050-22140-22225 (15 Minute Charts)
For positional traders, short-term support lies at 21500-21000, with resistance at 22300-22750.
BANK NIFTY OUTLOOK
In the preceding trading session, Bank Nifty concluded at 45963.15, experiencing a loss of 624.90 points. Technically, momentum indicators suggest a neutral trend, with the index closing below both short-term and medium-term moving averages. Additionally, a long black candle on the daily chart, closing near the day's low, signifies the potential continuation of the downtrend.
The index maintains intraday support at 45900; a breach of this level could extend the downtrend in the coming days. Conversely, intraday resistance stands at 46265.
For intraday traders, support levels are identified at 45900, 45600, and 45300, while resistance levels can be found at 46265, 46550, and 46800, as indicated by the 15-minute charts.
Positional traders should monitor short-term support levels at 45300-44450, with resistance at 47000-48500.
