NIFTY TECHNICAL OUTLOOK
Based on Market Closing on Monday, February 05, 2024
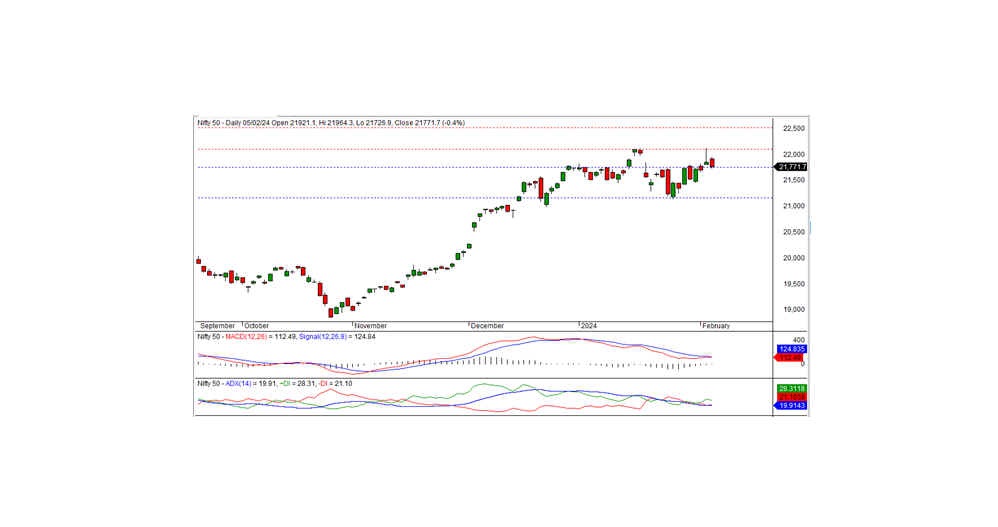
In the latest trading session, the Nifty concluded at 21771.10, experiencing a decline of -82.10 points or 0.38 percent. Sustained downward movement may persist if the Nifty dips below the 21750 mark.
The Nifty commenced trading with a positive bias, opening at 21921.10, and reached an intraday high of 21964.30. However, during the closing hours, the index declined, touching an intraday low of 21726.90 before settling at 21771.10. Notably, sectors like pharma, auto, realty, and metal witnessed gains, whereas FMCG, financial services, IT, and PSU banks encountered losses. Market breadth skewed negative, with 1027 stocks rising, 1425 declining, and 74 remaining unchanged. Leading the gainers under the Nifty were TATAMOTORS, COALINDIA, SUNPHARMA, and CIPLA, while UPL, BAJFINANCE, BHARTIARTL, and HDFCLIFE were among the major losers.
From a technical perspective, the Nifty maintains its position above short-term and long-term moving averages, with momentum indicators signaling a neutral trend. The formation of a black candle following the previous shooting star pattern on the daily chart suggests a potential continuation of the downtrend. In terms of support, the index has immediate backing at 21750 levels, and a close below this level could indicate further downside potential in the forthcoming sessions. The nearest intraday resistance is anticipated at 21800 levels.
Intraday Support levels -21700-21600-21500 Resistance levels –21800-21950-22050(15 Minute Charts)
Positional traders' short-term support levels remain at 21750-21160, with resistance at 22125 -22500

BANK NIFTY ANALYSIS
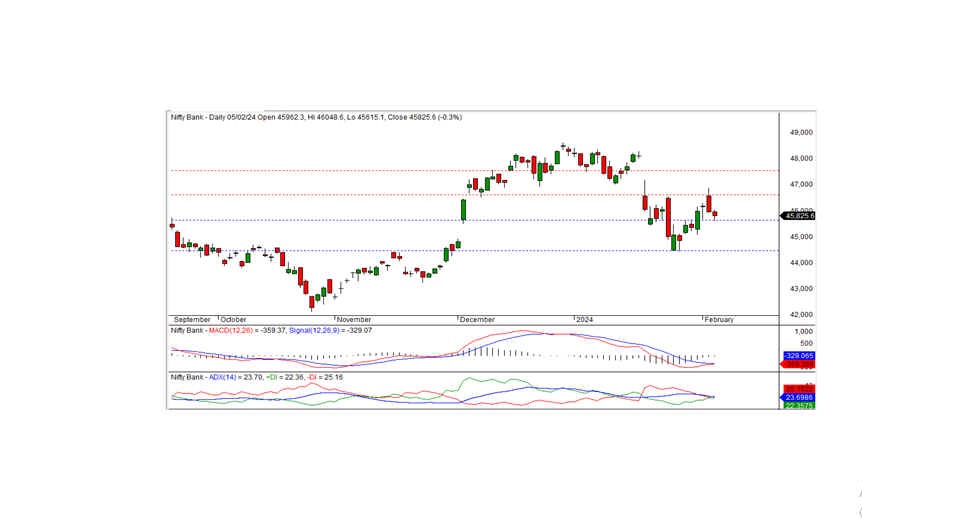
In the previous trading session, Bank Nifty concluded at 45825.60, marking a loss of -145.40 points. Technically, momentum indicators indicate a negative trend, with the index positioned below short-term moving averages. Additionally, a black candle formation on the daily chart, coupled with a close below the previous day's level, underscores the bearish sentiment. Immediate short-term support for the index is noted at 45600, and a breach below this level could sustain the downtrend in the forthcoming sessions. The closest intraday resistance is observed at 46000; a breakthrough above this level might trigger a pullback rally.
For intraday traders, support levels are situated at 45700, 45500, and 45300, while resistance levels can be identified at 46000, 46250, and 46500, as outlined by the 15-minute charts.
Positional traders are advised to monitor short-term support levels at 45600-44450, with resistance noted at 46600-47550.

