NIFTY TECHNICAL OUTLOOK
Based on Market Closing on Wednesday, February 21, 2024
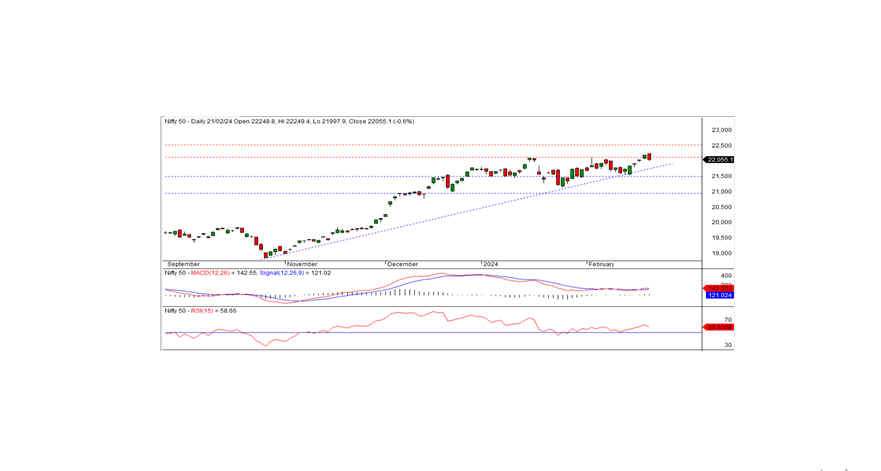
In the latest trading session, the Nifty concluded at 22055.05, marking a decline of -141.90 points or -0.64 percent. Should the Nifty dip below the 22000 level, the prevailing downtrend may persist today.
Opening at a new high of 22248.80, the Nifty struggled to maintain momentum, experiencing a sharp decline during afternoon trade, reaching an intraday low of 21997.90 before settling at 22055.05. Except for realty, PSU banks, and metal, all sectors closed with a negative bias. Media, IT, financial services, and auto sectors suffered notable losses. Market breadth leaned negative with 781 stocks rising, 1656 falling, and 102 remaining unchanged. Among the top gainers beneath the Nifty were TATASTEEL, SBIN, INDUSINDBK, and JSWSTEEL, while major losers included BPCL, COALINDIA, NTPC, and HEROMOTOCO.
Technically, the Nifty remains positioned above both short-term and long-term moving averages, with momentum indicators signaling a positive trend. However, the index formed a long black candle on the daily chart, closing below the previous day's level, resembling a bearish engulfing pattern. This candle suggests a slowdown in the recent uptrend and the potential shift towards a down. For further confirmation, the index needs to trade and sustain below the bearish engulfing pattern in subsequent sessions. Intraday support is observed at the 22000 level; sustaining below this may prolong the downtrend, otherwise, a pullback rally from the support level of 22000 is possible.
Intraday Levels: Support - 22000-21925-21850 Resistance - 22100-22175-22250 (15 Minute Charts)
For positional traders, short-term support lies at 21500-21000, with resistance at 22125-22500.
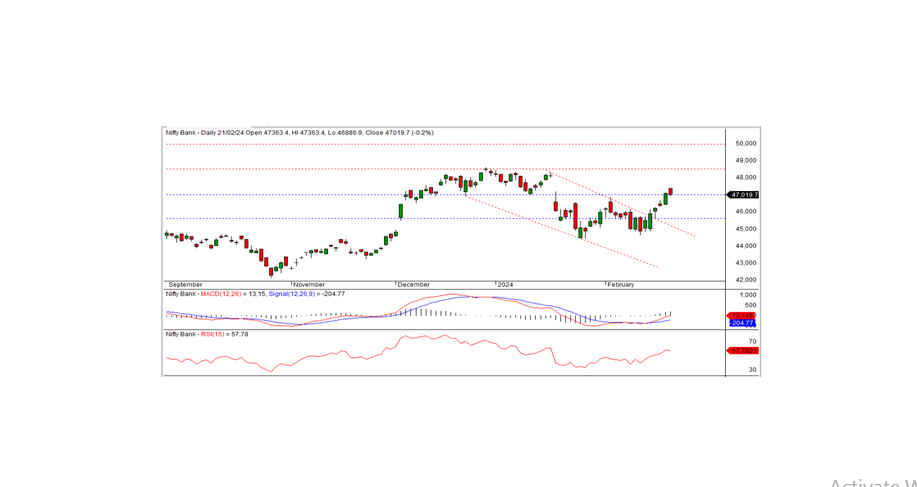
BANK NIFTY
In the previous trading session, Bank Nifty concluded at 47019.70, marking a loss of -74.50 points. From a technical standpoint, momentum indicators continue to signal a positive trend, with Bank Nifty positioned above both short-term and long-term moving averages. However, the index formed a black candle on the daily chart and closed below the previous day's close. On the downside, the index finds short-term support at 47000. A breach of this level could extend the downtrend today, otherwise a rebound rally might ensue from the support level.
For intraday traders, support levels are identified at 47000, 46700, and 46400, while resistance levels can be observed at 47300, 47550, and 47800, as per the 15-minute charts.
Positional traders are advised to monitor short-term support levels at 47000-45600, with resistance levels at 48500 - 50000.