Descending triangle
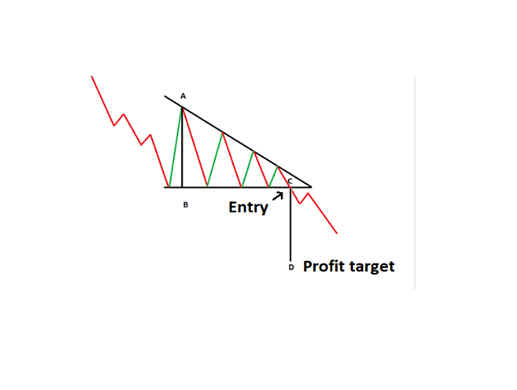
A descending triangle is a chart pattern in technical analysis that is formed by drawing two trend lines that connect a series of lower highs and a horizontal line that connects a series of lows. This pattern is considered a bearish pattern, as it typically signals that a stock or an asset is likely to see a price decrease.
In a descending triangle pattern, the trend line connecting the lower highs acts as resistance, while the horizontal line connecting the lows acts as support. If the price of the stock or asset breaks down below the support, it is usually considered a signal to sell, as the price is likely to continue to decrease.
However, if the price breaks out above the resistance, it can be considered a signal to take a long position, as the price is likely to continue to increase. It is important to keep in mind, though, that a break above the resistance does not guarantee a price increase, and it is always a good idea to consider additional factors, such as volume and market conditions, before taking a position.
It's important to remember that technical analysis should not be relied upon solely when making investment decisions. It's always a good idea to consider other factors, such as fundamental analysis, market conditions, and overall market trends, before making a trade based on a chart pattern.

