NIFTY TECHNICAL ANALYSIS
Market Closing on Thursday, January 11, 2024
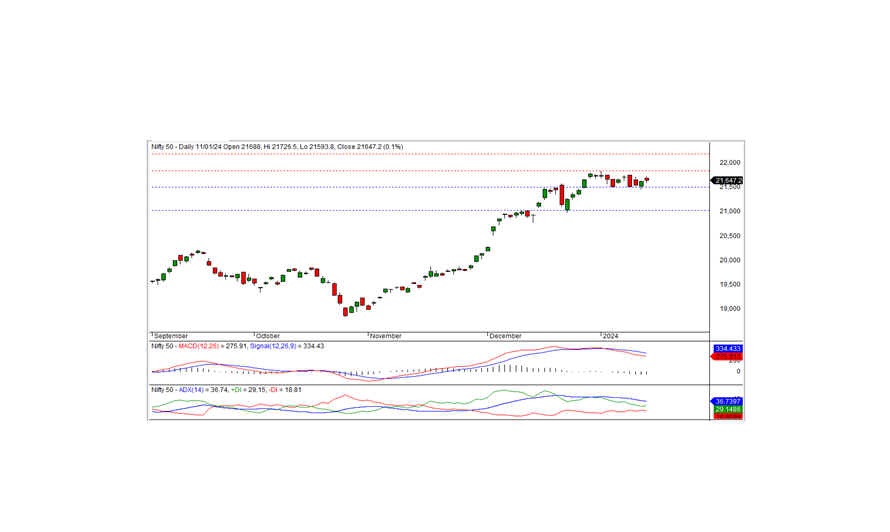
The last trading session, Nifty concluded at 21647.20, exhibiting a gain of 28.50 points or 0.13 percent. The current market scenario suggests an ongoing consolidation, possibly persisting for a few more days, within the trading range of 21450-21835.
The Nifty commenced the session on a positive note, opening at the 21688.00 level and reaching the intraday high of 21726.50. However, the index experienced a gradual decline, touching the intraday low of 21593.80 before ultimately closing at 21647.20. Sector-wise, auto, banks, and financial services experienced gains, while media, IT, FMCG, and pharma faced setbacks. Market breadth depicted positivity, with 1466 stocks ascending, 906 declining, and 142 holding steady. Noteworthy gainers under the Nifty included HEROMOTOCO, BAJAJ-AUTO, RELIANCE, and AXISBANK, whereas INFY, DR REDDY, SBILIFE, and HINDUNILVR were among the major losers.
From a technical standpoint, Nifty closed above its short-term moving averages, with momentum indicators signaling a neutral trend. The daily chart revealed the formation of a small black candle, suggesting a slightly positive bias as it closed just above the previous day's close. Despite this, Nifty remains within the consolidation band of 21450-21835, and the ongoing consolidation phase is anticipated to persist for a few more days. To establish a clear direction, the index must breach either of these consolidation levels.
Intraday Levels (15 Minute Charts): Support: 21600-21530-21450 Resistance: 21680-21765-21850
Positional Traders: Short-Term Support: 21500-21000 Resistance: 21835-22200

BANK NIFTY UPDATE
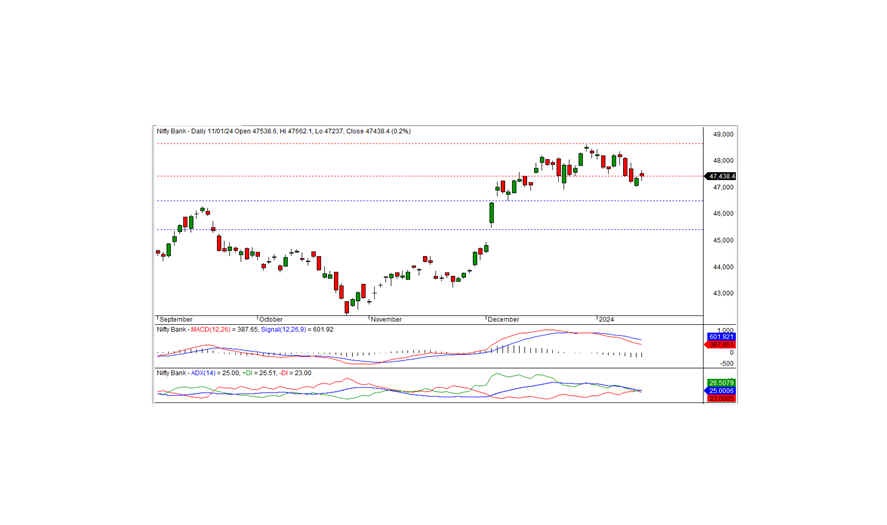
In the preceding trading session, Bank Nifty concluded at 47438.35, marking an increase of 77.50 points. Analyzing the technical aspects, momentum indicators currently suggest a negative trend, with the index positioned below short-term moving averages. On the daily chart, the index formed a black candle but managed to close just above the crucial resistance level of 47400. The sustainability above this level could extend the positive momentum; otherwise, a continuation of the recent downtrend might be observed.
For intraday traders, key support levels are identified at 47400, 47200, and 47000, while resistance levels are noted at 47600, 47850, and 48050, as indicated by the 15-minute charts.
Positional traders are advised to monitor short-term support levels situated at 46500-45400, with resistance observed at 47400 - 48650. This strategic observation will aid in navigating potential market movements in the coming sessions.

