
NIFTY Technical Analysis
Based on Market Closing on Thursday, March 14, 2024
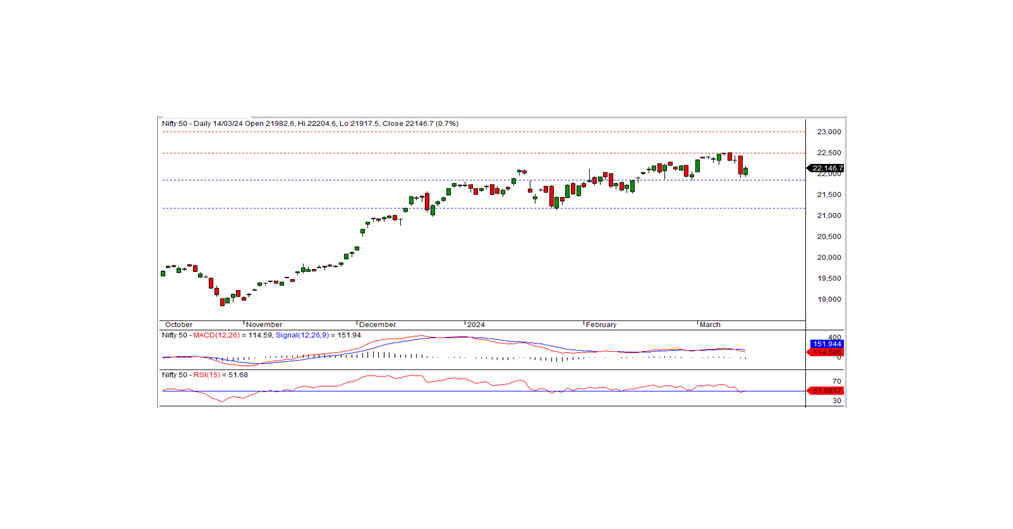
In the latest trading session, the Nifty concluded at 22146.65, marking a gain of 148.95 points or 0.68 percent. There is a possibility of a consolidation in the coming days, with 21850 providing short-term support.
During the trading session, the Nifty commenced at 21982.60 with a negative bias, touching an intraday low of 21917.50 in the morning session. Subsequently, the index surged, reaching an intraday peak of 22204.60 before settling at 22146.65. Noteworthy sectoral gainers included metal, IT, media, and pharma, while banking and financial services exhibited a bearish sentiment. Market breadth favored the positive side, with 1867 stocks advancing, 614 declining, and 81 unchanged. Prominent gainers comprised ADANIENT, DANIPORTS, HEROMOTOCO, and HINDALCO, while AXISBANK, INDUSINDBK, JSWSTEEL, and BAJFINANCE experienced significant losses.
Technically, the Nifty trails below its short-term moving averages, with momentum indicators indicating a negative trajectory. Nevertheless, the index formed a white candle on the daily chart, closing above the preceding day's level. Short-term support is evident in the 21850-900 range. A breach of this level may reignite the recent downtrend, otherwise, the nifty may consolidate above this support level for a few days. The nearest intraday resistance stands at 22200 levels.
Intraday Levels: Support: 22100, 22000, 21900 Resistance: 22200, 22300, 22430 (15-Minute Charts)
Positional Trading: Short-term Support: 21850-21200 Resistance: 22500-23000
BANK NIFTY Technical Analysis
During the preceding trading session, Bank Nifty concluded at 46789.95, marking a decline of -191.35 points. Momentum indicators continue to signal a negative trajectory, with the index persisting below its short-term moving averages. Additionally, the formation of a Doji candle on the daily chart, coupled with a close below the previous day's level, suggests the potential continuation of the downtrend. The immediate short-term resistance is observed at 47000, while support rests at the 46000 level.
For intraday traders, pivotal support levels are identified at 46680, 46450, and 46200, while resistance levels are noted at 46950, 47200, and 47430, as per the 15-minute charts.
Positional traders are advised to monitor short-term support levels ranging between 46000-44500, with resistance observed at 47000-48500.
