Nifty Technical Outlook
Based on Market Closing on Wednesday, April 24, 2024
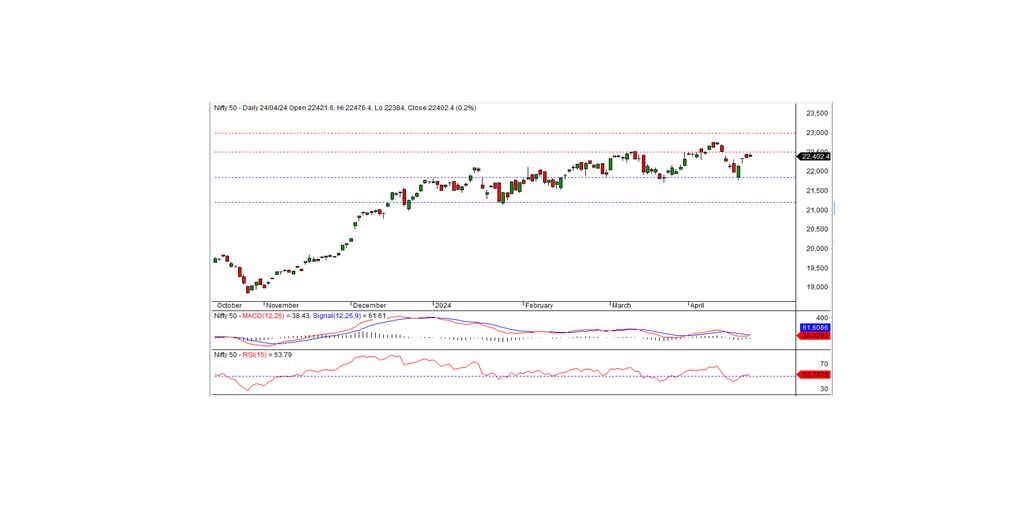
In the last trading session, the Nifty closed at 22,402.40, up by 34.40 points or 0.15 percent. The positive trend will continue if the Nifty trades and sustains above the intraday support level of 22,350.
During the last trading session, the Nifty opened at the 22,421.60 level on a positive note and tested an intraday high of 22,476.40 in the morning trade. Subsequently, the index gradually declined and reached an intraday low of 22,384 before closing at 22,402.40. The major gainers were the metal, realty, pharma, and financial service sectors, while the losers included IT, media, PSU banks, and auto companies. The market breadth was positive, with 1,483 stocks rising, 954 falling, and 162 remaining unchanged. The top gainers under the Nifty were HINDALCO, CIPLA, JSWSTEEL, and TATASTEEL, whereas the major losers included TATACONSUM, GRASIM, TECHM, and HDFCLIFE.
From a technical standpoint, the Nifty remains above both the short-term and medium-term moving averages. However, momentum indicators signal a negative trend. The index formed a black candle on the daily chart and closed within the range of the previous day's candle, indicating the possibility of consolidation. On the downside, the index has intraday support at 22,350. The positive trend may continue if the index trades and sustains above this level. The nearest short-term resistance remains at 22,500 levels.
Intraday Levels: Support - 22,350, 22,250, 22,155 Resistance - 22,475, 22,550, 22,650 (15-Minute Charts)
Positional Trading: Short-term Support - 21,850-21,200 Resistance - 22,500-23,000.
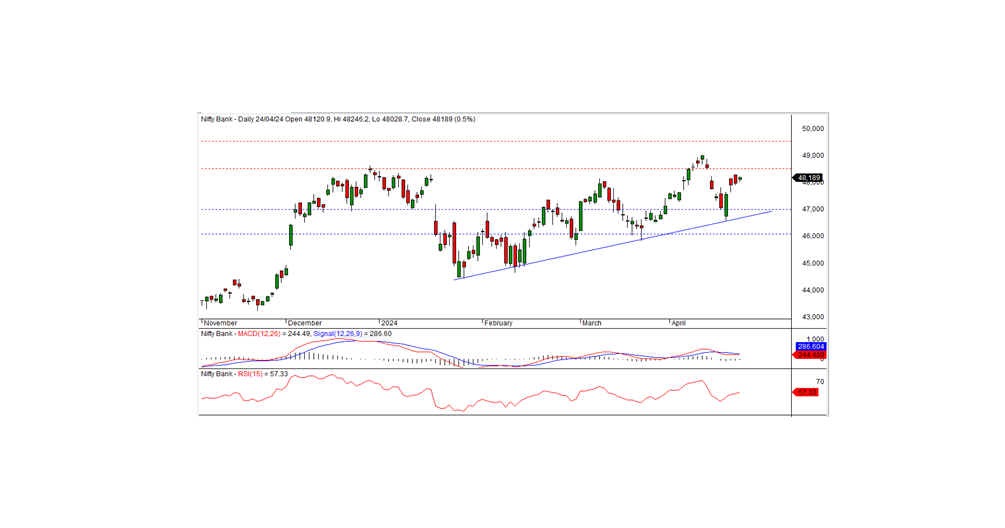
BANK NIFTY
In the preceding trading session, Bank Nifty closed at 48,189.00, registering a gain of 218.55 points. Technically, the momentum indicators signal a neutral trend, but the index remains above both the short-term and long-term moving averages. The index formed a small white candle on the daily chart and closed above the previous day's close, indicating that momentum remains in favor of the bulls. The nearest intraday support lies at 48,070, with resistance standing at 48,300. The index must surpass the resistance level of 48,300 to continue the uptrend.
For intraday traders, the support levels are at 48,070, 47,850, and 47,600, while resistance levels can be identified at 48,300, 48,500, and 48,700 as indicated by the 15-minute charts.
Positional traders should monitor short-term support levels at 47,000-46,000, with resistance at 48,500-49,500.