NIFTY TECHNICAL OUTLOOK
As of the market closing on Monday, November 20, 2023
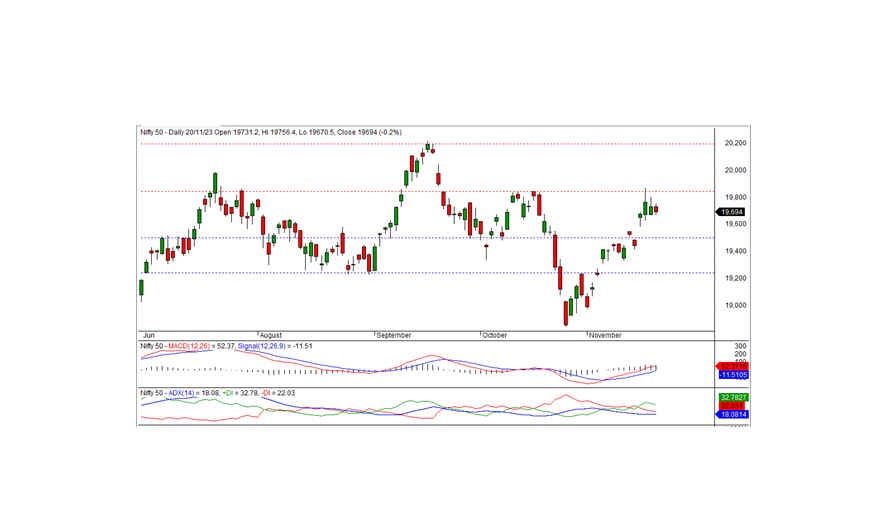
The Nifty concluded the trading session at 19,694.00, experiencing a loss of -37.80 points or -0.19 percent. A potential continuation of the downtrend is possible if the Nifty falls below the 19,665.00 level.
Opening at 19,731.20, the Nifty maintained a flat note and reached an intraday high of 19,756.40 during the morning trade. Subsequently, the index gradually declined, reaching an intraday low of 19,760.50 before settling at 19,694.00. Noteworthy positive bias was observed in the IT, PSU bank, and pharma sectors, while the auto, media, metal, and FMCG sectors faced negative bias.
Market breadth leaned negative, with 1,144 stocks rising, 1,206 falling, and 141 remaining unchanged. Top gainers under the Nifty included DIVISLAB, BHARTIARTL, HCLTECH, and WIPRO, while major losers were ADANIENT, BAJFINANCE, M&M, and SBILIFE.
From a technical standpoint, the Nifty remains positioned above both short-term and long-term moving averages, with momentum indicators signaling a positive trend. However, the formation of a black candle on the daily chart, closing within the previous day's candle, suggests a potential consolidation. Intraday support for the Nifty is identified at the 19,665 level; a breach below this level may sustain the downward trend. The nearest intraday resistance is situated at 19,800 levels, and surpassing this level is crucial for establishing a positive trend.
Intraday Levels: Support - 19,665-19,575-19,500 Resistance - 19,800-19,875-19,950 (15 Minute Charts)
For positional traders, short-term support levels are maintained at 19,500-19,233, with resistance at 19,850-20,200.

BANK NIFTY
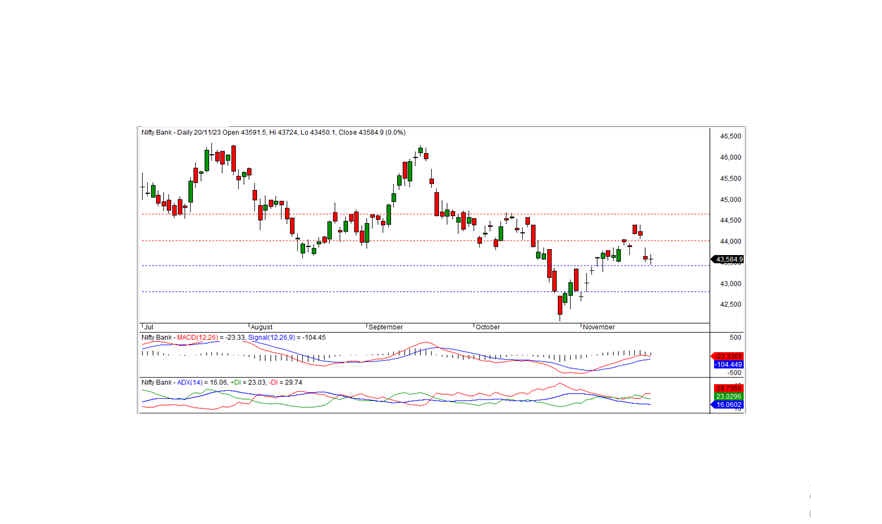
In the previous trading session, Bank Nifty concluded at 43,584.95, marking a minimal loss of -1 point. From a technical standpoint, momentum indicators suggest a positive trend; however, the index remains below the short-term moving averages.
Despite this, the index formed a Doji candle and closed near the previous day's close, hinting at the potential for consolidation. The short-term support holds steady at 43,500, and if the index maintains above this level, the consolidation phase could persist for a few more days. To trigger a pullback rally, it is imperative for the index to surpass the 43,725 level. Conversely, a dip below the support at 43,500 may usher in a short-term downward trend.
For intraday traders, key support levels are identified at 43,500, 43,300, and 43,100, while resistance levels can be pinpointed at 43,725, 43,900, and 44,100, as per the 15-minute charts.
Positional traders are advised to monitor short-term support levels at 43,500-42,800, with resistance encompassed in the range of 44,000 to 44,650. Stay vigilant for potential market movements within this specified range.

