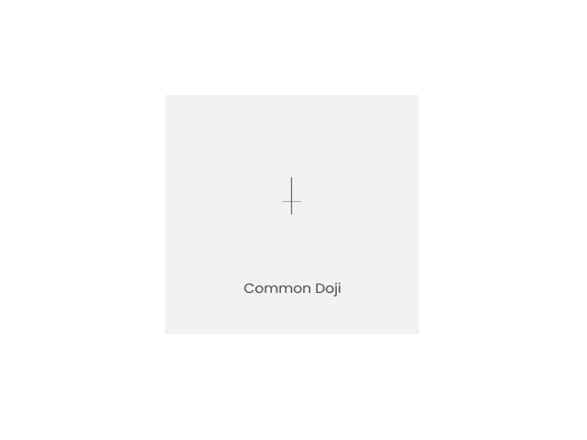
Common Doji candlestick Pattern
A Doji candlestick is formed when the opening and closing price of a security is almost equal, and it also has upper and lower shadows. It indicates an uncertain situation for both the buyers and sellers and it represents a supply/demand equilibrium.
If a market is not clearly trending, a Doji may not be significant since non-trending markets are naturally indecisive. However, if a Doji form in an uptrend or downtrend, it is generally considered significant. When formed in an uptrend, a Doji is a signal that the buyers are losing confidence, while in a downtrend, it is a signal that the sellers are losing confidence. It is worth noting that not all Doji patterns are the same, and there are several variations that can impact the signal's strength.
In summary, a Doji candlestick is formed when the opening and closing prices of a security are almost equal, indicating a supply/demand equilibrium and uncertainty for both buyers and sellers. A Doji formed in an uptrend signals a loss of buyer confidence, while one in a downtrend indicates a loss of seller confidence. However, the strength of the signal may vary based on the type of Doji pattern observed.

