Candlestick Patterns: A Useful Tool for Technical Analysis
Candlestick patterns are a popular charting technique used in technical analysis to identify potential trend reversals or continuations in the price movements of financial assets, such as stocks, commodities, or currencies. The pattern is formed by combining one or more candlesticks and analyzing their shape, size, and position in the chart.
The origins of candlestick charting can be traced back to Japan in the 18th century, when it was used to trade rice futures. Munehisa Homma, a Japanese rice trader, is credited with creating the first candlestick charts by recording price movements and analyzing patterns in the rice market. Over time, other Japanese traders refined and expanded upon Homma's methods, which eventually gained popularity in the Western world through the work of Steve Nison in the 1990s.
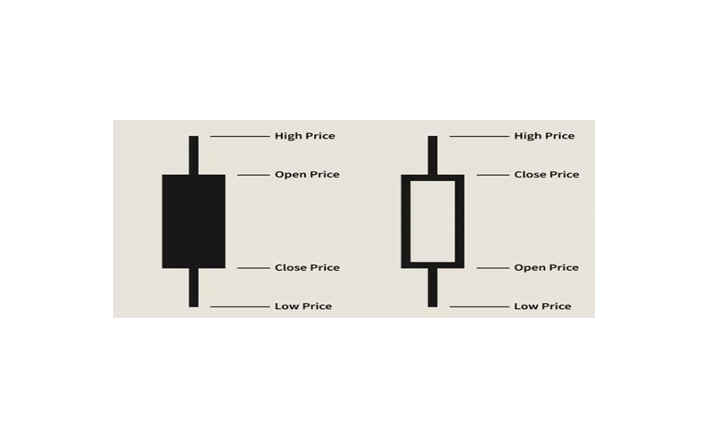
Candlestick charts are a popular tool used in technical analysis to visually represent the price movements of an asset for a given period. Candlestick charts also display the high, low, opening, and closing prices of an asset for a given period. They are represented as a series of "candlesticks", where the top and bottom of each candlestick represent the high and low prices, and the body of the candlestick represents the opening and closing prices.
Candlestick patterns are a valuable tool for traders and investors looking to make informed investment decisions. By recognizing potential trend reversals or continuations, traders can interpret patterns and make trading decisions based on their analysis. For instance, a bullish reversal pattern, like a "hammer" or "bullish engulfing," might indicate a potential trend reversal from a bearish to a bullish trend and could signal a buying opportunity for traders. Conversely, a bearish reversal pattern, such as a "shooting star" or "bearish engulfing," might indicate a potential trend reversal from a bullish to a bearish trend and could signal a selling opportunity for traders.
It's important to keep in mind that candlestick patterns are just one aspect of technical analysis, and traders need to combine them with other indicators and analysis tools to make informed trading decisions. Proper risk management and money management are also crucial to avoid potential losses.
In summary, candlestick patterns can be a valuable part of a trader's toolkit when used in conjunction with other analysis tools and techniques. Traders and investors who combine candlestick patterns with other indicators and market data gain a comprehensive understanding of market trends and potential trading opportunities, making informed investment decisions and managing risks effectively.

