NIFTY Technical Outlook
Based on Market Closing on Friday, June 28, 2024
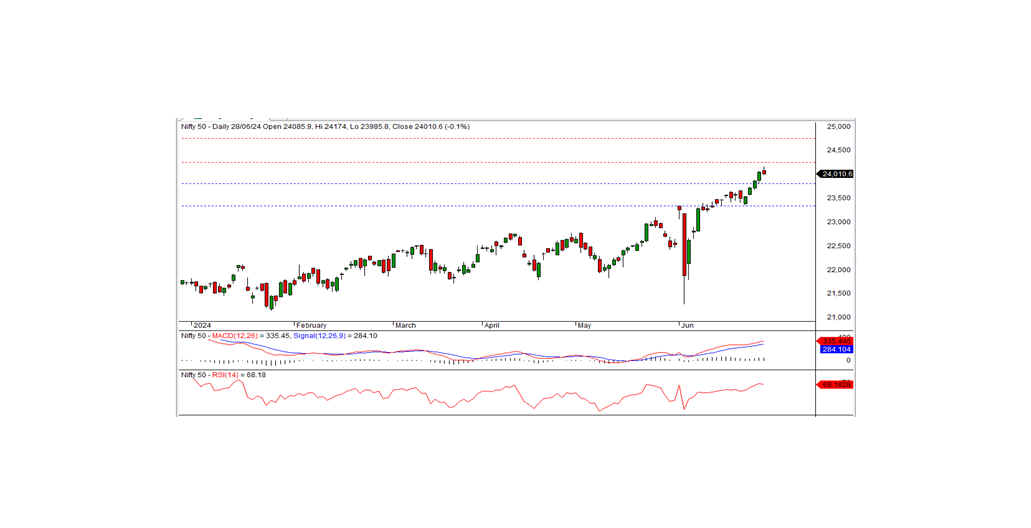
In the last trading session, the Nifty closed at 24010.60, down 33.90 points or 0.14 percent. The bullish trend can resume if the Nifty remains above the 24000 level.
The Nifty opened at 24085.90 with a positive bias and tested the record high of 24174.00 in the morning trade. However, the index gradually fell, hitting an intraday low of 23985.80 before finally closing at 24010.60. The pharma, PSU bank, realty, and metal sectors were the top gainers, while the losers included banks, financial services, and media. The market breadth was positive with 1341 stocks rising, 1176 falling, and 103 remaining unchanged. The top gainers in the Nifty index were DRREDDY, ONGC, RELIANCE, and SBILIFE, while the major losers were INDUSINDBK, BHARTIARTL, AXISBANK, and ICICIBANK.
From a technical standpoint, the momentum indicators signal a positive trend. The Nifty remains above the long-term and short-term moving averages. However, the index formed a black candle on the daily chart and closed below the previous day's close, indicating a slightly negative bias. On the lower side, the index has intraday support at the 24000 level. If the index remains above this level, the recent bullish trend can resume. The nearest intraday resistance is at the 24100 level.
Intraday Levels: Support: 24000, 23900, 23800 Resistance: 24100, 24175-24250 (15-Minute Charts)
Positional Trading: Short-term Support: 23800-23350 Resistance: 24250-24750
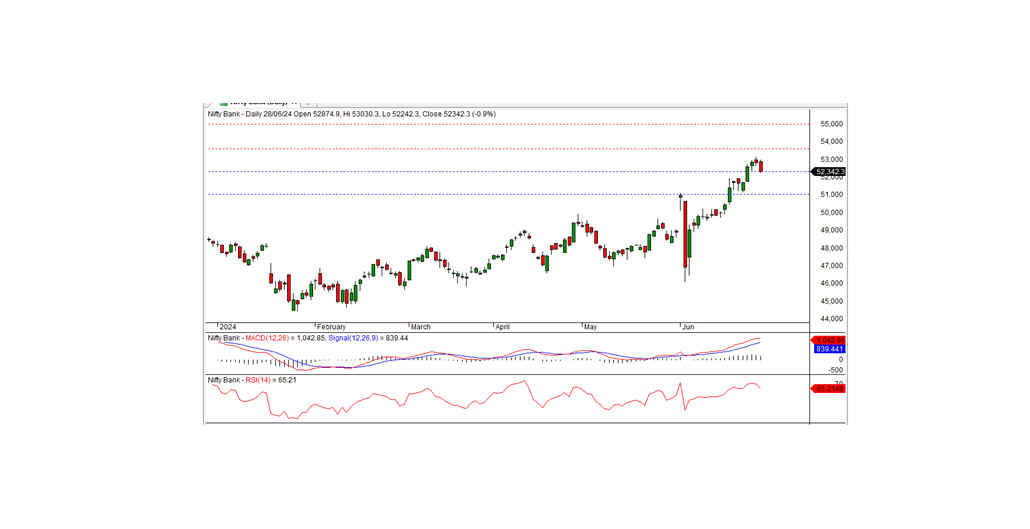
Bank Nifty Technical Outlook
In the preceding trading session, Bank Nifty closed at 52342.25, registering a loss of 469.05 points. Technically, the momentum indicators signal a positive trend, and the index remains above the medium-term and short-term moving averages. However, the index formed a black candle on the daily chart and closed below the previous day's close. On the lower side, the index has short-term support at the 53000 level. The downward bias can continue today if the index moves below this level. Otherwise, the index may consolidate above this level for a few days. The nearest intraday resistance is at 52525.
Intraday Levels: Support: 52200, 51950, 51650 Resistance: 52525, 52850, 53150 (15-Minute Charts)
Positional Trading: Short-term Support: 52300-51000 Resistance: 53600-55000