NIFTY TECHNICAL OUTLOOK
Based on Market Closing on Monday, April 29, 2024
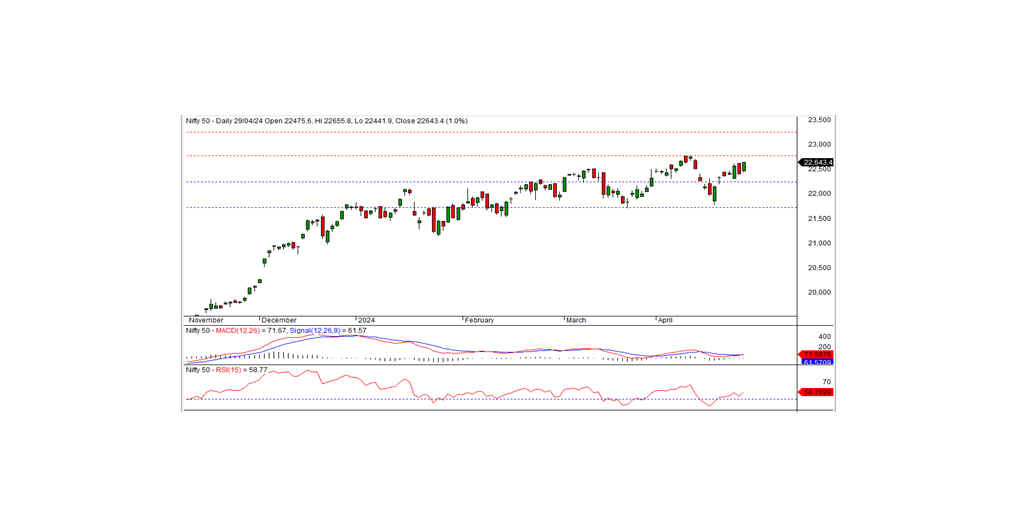
In the recent trading session, the Nifty closed at 22,643.40, marking a gain of 223.45 points or 1.00 percent. The positive momentum is likely to persist if the Nifty maintains trading above the intraday support level of 22,625.
During the last trading session, the Nifty commenced at 22,475.60 with a positive stance, maintaining its upward trajectory and reaching an intraday high of 22,655.80 before settling at 22,643.40. Noteworthy gainers included banks, financial services, pharmaceuticals, and metal sectors, while realty, IT, and auto sectors experienced notable declines. Market breadth favored the positive side, with 1,243 stocks witnessing gains, 1,214 facing losses, and 144 remaining unchanged. Top performers within the Nifty included ICICIBANK, SBIN, INDUSINDBK, and ULTRACEMCO, whereas notable decliners encompassed HCLTECH, APOLLOHOSP, BAJAJ-AUTO, and HDFCLIFE.
From a technical perspective, the Nifty continues to hold above both short-term and long-term moving averages, with momentum indicators suggesting a favorable trend. Additionally, the formation of a white candle on the daily chart and the close near the day's high indicates a potential continuation of the uptrend. On the downside, intraday support is observed at the 22,625 level. The ongoing bullish trend will continue if the index remains above this level. On the upside, short-term resistance is located at the 22,775 level.
Intraday Levels: Support - 22,625, 22,550, 22,475 Resistance - 22,700, 22,775, 22,850 (Based on 15-Minute Charts)
Positional Trading: Short-term Support - 22,250-22,700 Resistance - 22,775-23,250
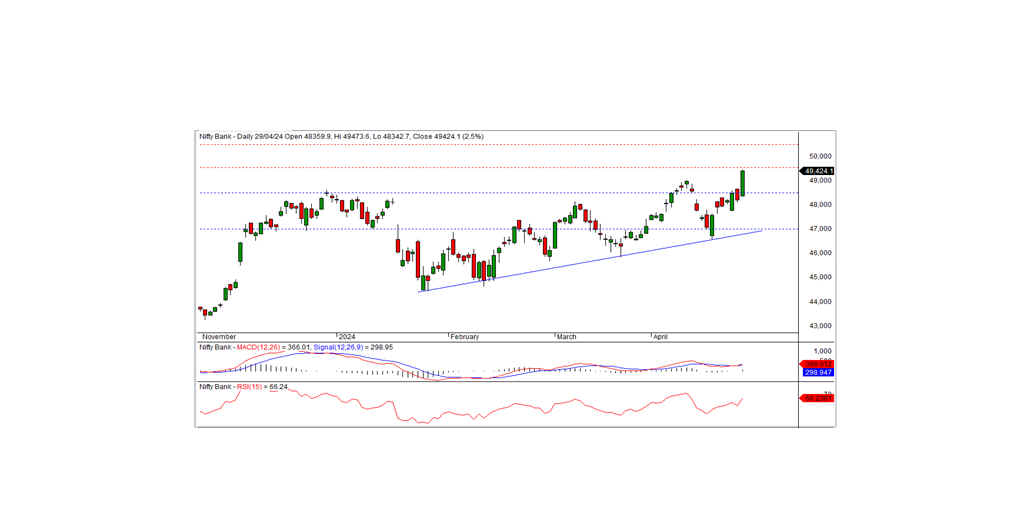
BANK NIFTY
In the preceding trading session, Bank Nifty closed at a record high of 49424.05 registering a gain of 1223.00 points. From a technical standpoint, momentum indicators still signal a bullish trend, with the index maintaining positions above both short-term and long-term moving averages. Furthermore, the index formed a long white candle on the daily chart and closed at a record high, reinforcing the likelihood of continuing bullish momentum.
Looking ahead, the index faces short-term resistance at the 49,500 level. A breach of this level could sustain the bullish trend in the forthcoming sessions. The nearest intraday support is identified at 49,200.
For intraday trading strategies, support levels are noted at 49,200, 48,900, and 48,650, while resistance levels can be identified at 49,500, 49,800, and 50,100, as delineated by the 15-minute charts.
Positional traders are advised to monitor short-term support levels in the range of 48,500-47,000, with resistance anticipated at 49,500-50,500.