NIFTY TECHNICAL OUTLOOK
Based on Market Closing on Thursday, February 22, 2024
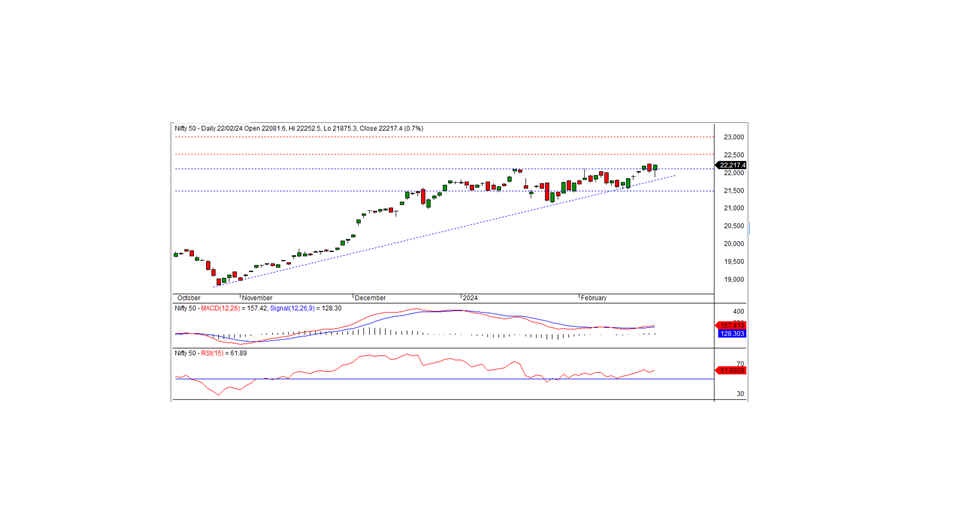
In the latest trading session, the Nifty closed at 22217.45, marking a gain of 162.40 points or 0.74 percent. If the Nifty surpasses the 22250 level, it could sustain the positive trend into today's session.
The Nifty opened the session at 22081.60 on a positive note but failed to maintain momentum, dipping to an intraday low of 21875.30. However, during afternoon trade, the index rebounded, testing a high of 22252.50. With the exception of PSU banks and financial services, all sectors closed with a positive bias. The IT, auto, metal, and media sectors witnessed significant gains. Market breadth was positive, with 1234 stocks rising, 1197 falling, and 107 remaining unchanged. Notable gainers under the Nifty included BAJAJ-AUTO, HCLTECH, EICHERMOT, and COAL INDIA, while major losers comprised INDUSINDBK, HDFCBANK, KOTAKBANK, and BPCL.
From a technical perspective, the Nifty remains above both short-term and long-term moving averages. Momentum indicators suggest a positive trend. Additionally, the index formed a white candle on the daily chart and closed near the day's high. The Nifty faces intraday resistance at 22250 levels. Sustained trading above this level could extend the positive trend in the coming days, with the nearest intraday support at 22175 levels.
Intraday Levels: Support: 22175-22100-22000 Resistance: 22250-22325-22400 (15 Minute Charts)
Positional Levels: Short-term Support: 22125-21500 Short-term Resistance: 22500-23000
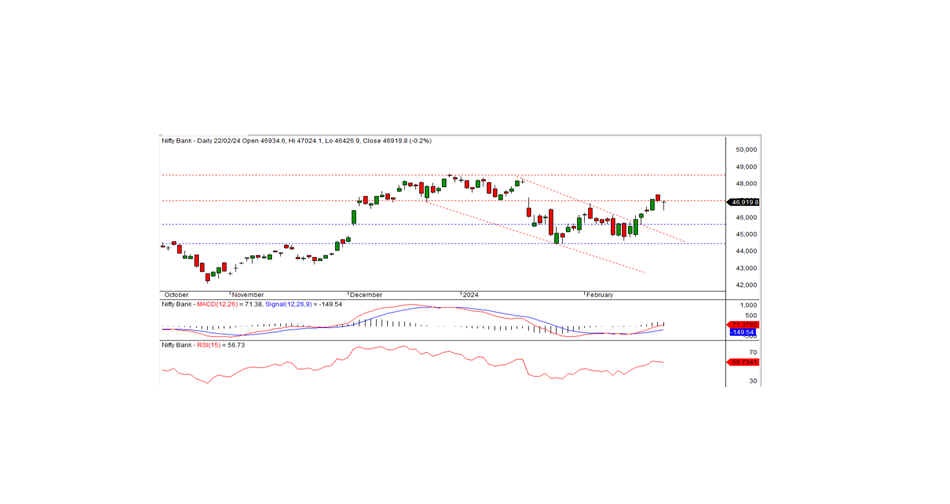
BANK NIFTY
In the previous trading session, Bank Nifty closed at 46918.80, experiencing a decrease of -99.90 points. From a technical standpoint, momentum indicators continue to signal a positive trend, while the Nifty remains positioned above both short-term and long-term moving averages. However, the index formed a Doji candle on the daily chart and closed below the support of 47000. The long lower shadow of the candle suggests buying interest emerged near the support zone. Sustained trading above the 47000 level could signal a continuation of the recent bullish trend; otherwise, the negative trend may persist today. On the downside, the index finds intraday support at 46700.
For intraday traders, support levels are identified at 46700, 46400, and 46100, while resistance levels are seen at 47000, 47300, and 47550 according to the 15-minute charts.
Positional traders are advised to monitor short-term support levels at 45600-44500, with resistance observed at 47000 - 48500.