NIFTY TECHNICAL ANALYSIS
Based on Market Closing on Thursday, February 15, 2024
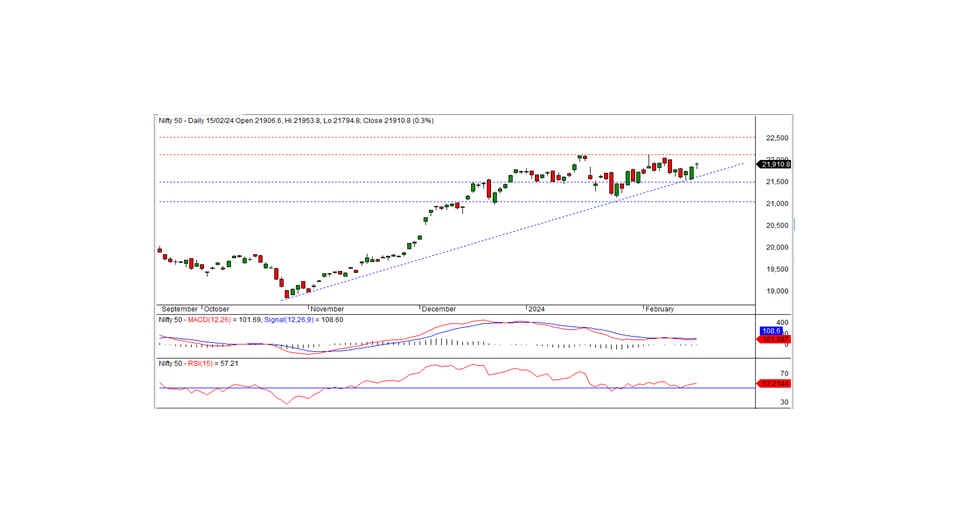
The Nifty concluded the trading session at 21910.75, marking a gain of 70.70 points or 0.32 percent. Sustaining above 21800, the Nifty could extend its positive trajectory in the forthcoming sessions.
Commencing at 21906.60 with a favorable bias, the Nifty experienced a gradual decline, touching the day's low at 21794.80. However, during afternoon trading, the index surged, reaching an intraday high of 21953.80 before settling at 21906.60. Apart from the FMCG, media, and pharma sectors, which closed with marginal losses, all other sectors concluded positively, with bank, auto, and realty sectors leading the gains. Market breadth favored advancement, with 1543 stocks ascending, 894 declining, and 100 remaining unchanged. Notably, M&M, BPCL, NTPC, and ONGC emerged as top gainers, while AXISBANK, APOLLOHOSP, ITC, and HINDUNILVR recorded notable losses.
Technically, the Nifty persists above both short-term and long-term moving averages, with momentum indicators signaling a bullish trend. Despite forming a Doji candle on the daily chart, the index closed higher than the previous day, reflecting a positive sentiment. Maintaining trade above the 21800 mark could sustain the positive momentum in subsequent sessions, with the next resistance anticipated at 22125. It is crucial to close above this level to establish a robust bullish trend.
Intraday Support Levels: 21860-21800-21725 Resistance Levels: 21950-22025-22100 (Based on 15-Minute Charts)
For positional traders, short-term support levels stand at 21500-21000, with resistance observed at 22125-22500.
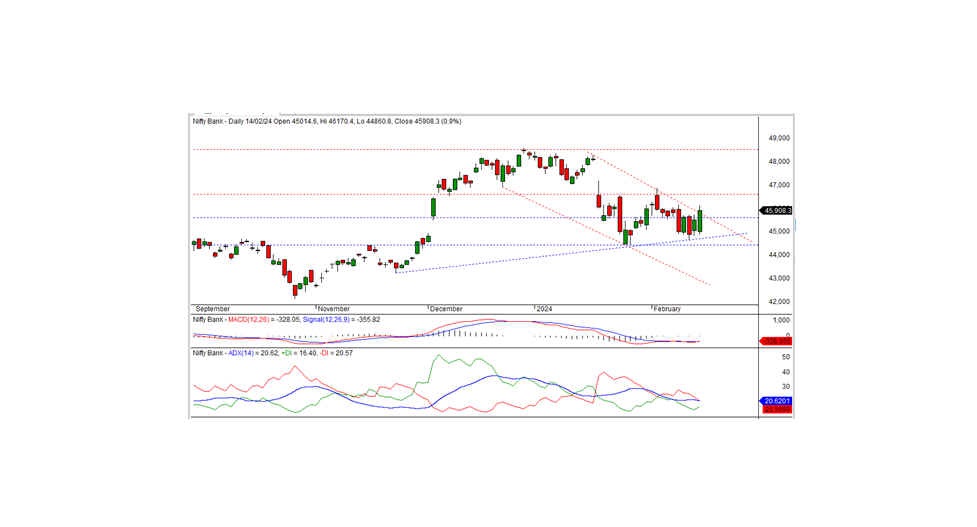
BANK NIFTY OUTLOOK
In the previous trading session, Bank Nifty concluded at 46218.90, marking an uptick of 310.60 points. Momentum indicators suggest a favorable trend, with Bank Nifty maintaining its position above both short-term and long-term moving averages. Additionally, the formation of a white candle on the daily chart, coupled with a close above the preceding day's level, signals renewed buying interest, notably evidenced by the long lower shadow of the candle near the support zone. These factors collectively indicate a potential continuation of the bullish trajectory. Sustaining above the 46000 mark may pave the way for a test of the next short-term resistance at 47000 in the days ahead.
For intraday traders, key support levels are situated at 46000, 45700, and 45400, while resistance levels can be identified at 46300, 46600, and 46900, as depicted by the 15-minute charts.
Positional traders are advised to monitor short-term support levels at 45600-44450, with resistance zones observed at 47000-48500.