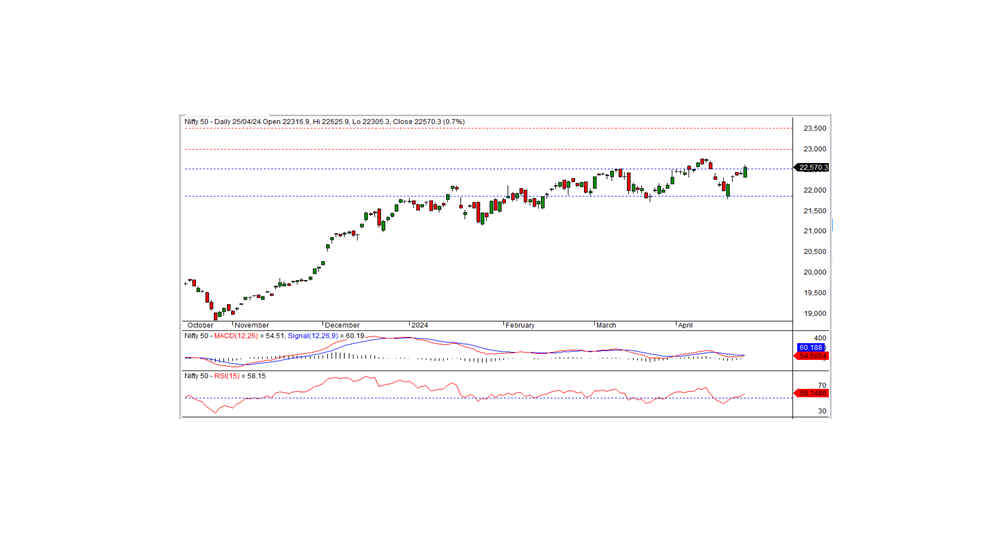
NIFTY TECHNICAL OUTLOOK
Based on Market Closing on Thursday, April 25, 2024
In the latest trading session, the Nifty concluded at 22570.35, marking a gain of 167.95 points or 0.75 percent. Sustaining above the short-term support level of 22500 will likely prolong this positive trajectory.
Commencing the session at 22316.90, the Nifty initially exhibited a negative sentiment, dipping to an intraday low of 22305.30. However, it swiftly reversed course, reaching an intraday high of 22625.90 before settling at 22570.35. Except for realty, all sectors closed positively. Key sectors such as PSU banks, pharma, auto, and metal experienced significant gains. Market breadth favored the positive side, with 1339 stocks rising, 1108 falling, and 152 remaining unchanged. Among Nifty constituents, top performers included AXISBANK, SBIN, DR REDDY, and JSWSTEEL, whereas KOTAKBANK, LTIM, HINDUNILVR, and SBILIFE faced notable losses.
Technically, the Nifty remains positioned above both short-term and long-term moving averages, with momentum indicators signaling a bullish trend. Notably, a long white candle formation on the daily chart, coupled with a breakthrough above the resistance level of 22500, suggests a continuation of the bullish sentiment. The positive momentum is likely to persist if the index maintains its position above 22500, with the next resistance anticipated at the 23000 level.
Intraday Levels: Support - 22500, 22400, 22300 Resistance - 22600, 2270, 22800 (15-Minute Charts)
Positional Trading: Short-term support - 22500-21850 Resistance - 23000-23500.
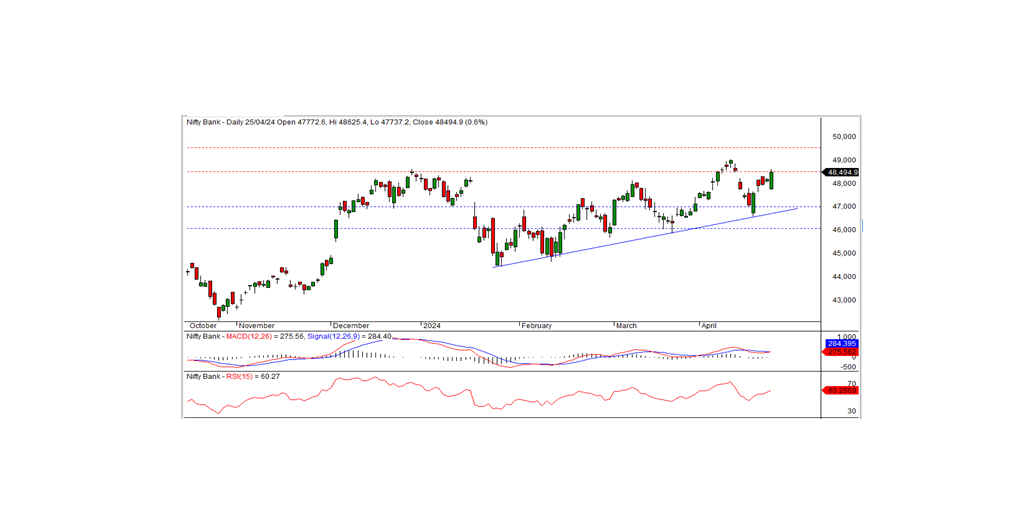
BANK NIFTY
In the previous trading session, Bank Nifty concluded at 48494.95, marking a gain of 305.95 points. Technically, momentum indicators signal a positive trend, with the index positioned above both short-term and long-term moving averages. Notably, the index formed a long white candle on the daily chart, closing near the resistance level of 48500, indicative of ongoing bullish momentum. A breakthrough above the short-term resistance level of 48500 is likely to sustain the bullish trend in the forthcoming sessions. On the downside, the nearest intraday support is observed at 48300 levels.
For intraday traders, support levels are identified at 48300, 48000, and 47750, whereas resistance levels are at 48600, 48850, and 49100 as delineated by the 15-minute charts.
Positional traders should monitor short-term support levels in the range of 47000-46000, with resistance noted at 48500-49500.