NIFTY TECHNICAL ANALYSIS
Based on Market Closing on Wednesday, January 24, 2024
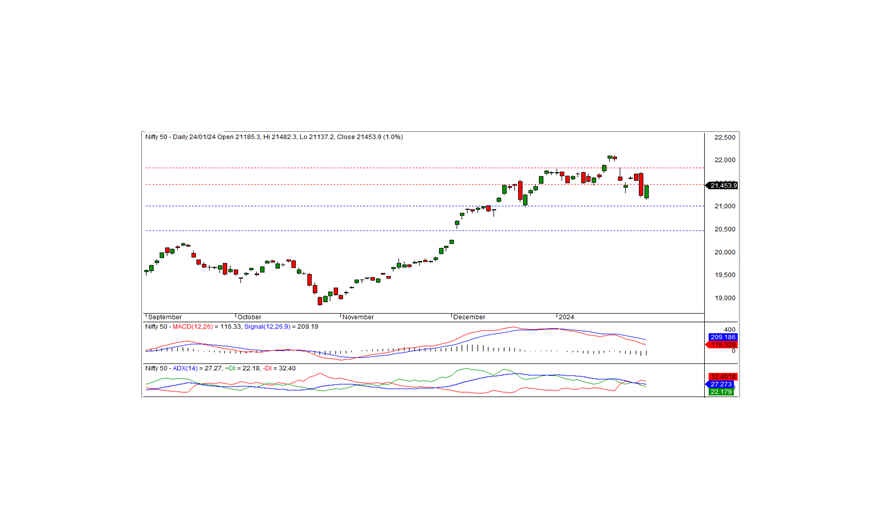
In the latest trading session, the Nifty exhibited robust performance by closing at 21,453.95, marking an impressive gain of 215.15 points or 1.01 percent. To sustain the bullish momentum, the index must overcome the resistance barrier set at 21,500.
Commencing the day at 21,185.35 with a negative tone, the Nifty experienced an initial dip to an intraday low of 21,137.20 in the morning session. However, a subsequent upward movement saw the index reaching an intraday high of 21,482.30 before settling at 21,453.95 by the end of the trading day. Except for private banks, all sectors closed positively, with media, metal, PSU banks, and FMCG sectors leading the gains. The market breadth displayed positivity, with 1,607 stocks rising, 825 falling, and 88 maintaining their unchanged status.
Top gainers beneath the Nifty included HINDALCO, DR REDDY, TATASTEEL, and POWERGRID, whereas major losers comprised ICICIBANK, AXISBANK, ASIANPAINT, and ADANIPORTS.
From a technical perspective, the Nifty remains positioned below short-term moving averages, signaling a negative trend according to momentum indicators. However, the daily chart indicates the formation of a long white candle, concluding above the previous day's closing level. The immediate resistance for the index is identified at 21,500, and a breach beyond this level could pave the way for further upward movement. The closest intraday support is situated at 21,400 levels.
Technical Levels: Intraday Support: 21,400 - 21,300 - 21,200 Resistance: 21,500 - 21,600 - 21,700 (15 Minute Charts)
For positional traders, short-term support is upheld at 21,000 - 20,500, while resistance lies between 21,500 and 21,835. Monitoring these levels will be crucial for navigating market trends in the near term.
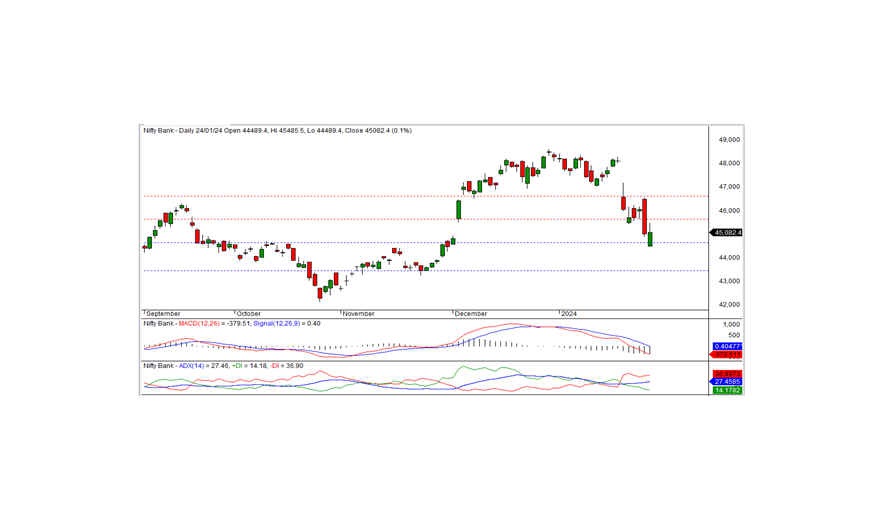
BANK NIFTY
In the most recent trading session, Bank Nifty concluded at 45,082.40, marking a modest gain of 67.35 points. From a technical standpoint, momentum indicators suggest a negative trend, with the index positioned below both short-term and medium-term moving averages. Nevertheless, a positive development was observed as the index formed a long white candle on the daily chart, closing above the preceding day's close.
On the upside, the index faces intraday resistance at the 45,200 level. A breakthrough beyond this level could potentially extend the positive trend today. The subsequent short-term support is identified at 44,600 levels.
For intraday traders, support levels are situated at 44,900, 44,600, and 44,300, while resistance levels can be identified at 45,200, 45,450, and 45,700 based on insights from 15-minute charts.
Technical Levels: Intraday Support: 44,900 - 44,600 - 44,300 Resistance: 45,200 - 45,450 - 45,700 (15 Minute Charts)
Positional traders are advised to closely monitor short-term support levels at 44,600-43,500, with resistance levels established at 45,600 and 46,600.