NIFTY TECHNICAL OUTLOOK
Based on Market Closing on Thursday, December 21, 2023
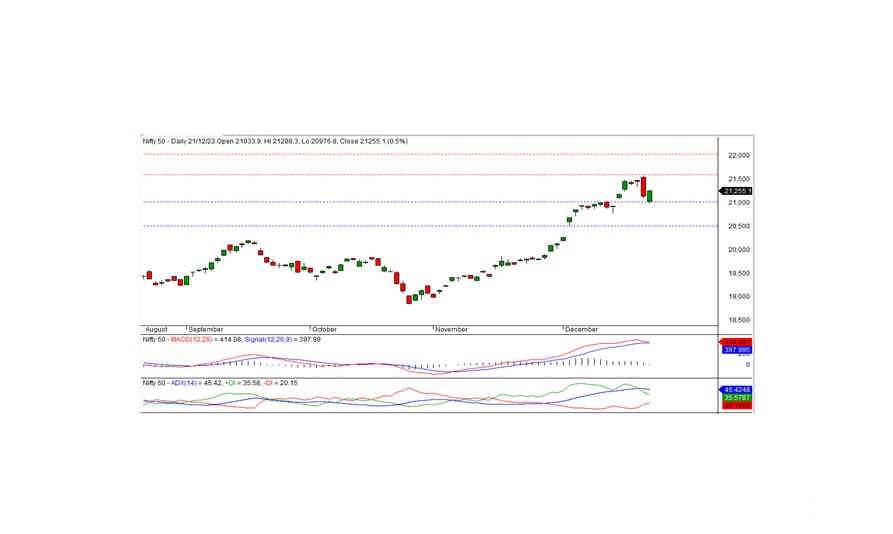
The Nifty concluded the trading session at 21,255.05, recording a gain of 104.90 points or 0.50 percent. To sustain the bullish momentum, the index must surpass the intraday resistance at 21,290.
The day began with the Nifty opening at the 21,033.90 level, reflecting a negative start. The intraday low of 20,976.80 was reached in the morning trade. However, the index rebounded and tested the intraday high of 21,288.30 before closing at 21,255.05. All sectors closed with a positive bias, with notable gains in media, PSU banks, metals, and realty. The market breadth was positive, with 1,760 stocks rising, 647 falling, and 83 remaining unchanged. Top gainers under the Nifty included BPCL, POWERGRID, BRITANNIA, and HDFCBANK, while major losers were BAJAJ-AUTO, BAJFINANCE, AXISBANK, and HCLTECH.
From a technical standpoint, the Nifty remains positioned above both short-term and long-term moving averages. Momentum indicators signal a positive trend, and the daily chart displays a white candle closing above the previous day's close, indicating the potential for an uptrend. On the higher side, the index faces intraday resistance at 21,290 levels. If the index surpasses this level, the positive trend is likely to continue. The nearest intraday support is at 21,175 levels.
Intraday Levels: Support: 21,175 - 21,070 - 20,975 Resistance: 21,290 - 21,400 - 21,500 (15-Minute Charts)
For Positional Traders: Short-Term Support: 21,000 - 20,500 Resistance: 21,600 - 22,000

BANK NIFTY
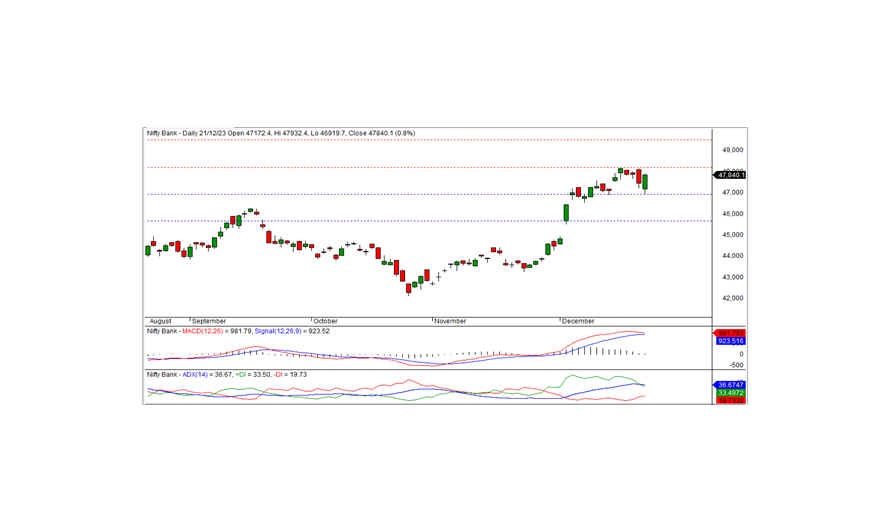
In the preceding trading session, Bank Nifty concluded at 47,840.15, marking a gain of 394.85 points. From a technical standpoint, momentum indicators signal a positive trend, and the index remains positioned above both short-term and long-term moving averages. Furthermore, the daily chart displays a white candle closing above the previous day's close, suggesting the potential continuation of the uptrend. On the higher side, the index faces intraday resistance at 47,925. If the index surpasses this level, the positive trend may persist.
For intraday traders, support levels are identified at 47,625, 47,350, and 47,060, while resistance levels can be found at 47,925, 48,170, and 48,400, as indicated by the 15-minute charts.
Positional traders are advised to monitor short-term support levels at 47,000-45,670, with resistance identified at 48,200 - 49,500.

