NIFTY TECHNICAL OUTLOOK - November 15, 2023
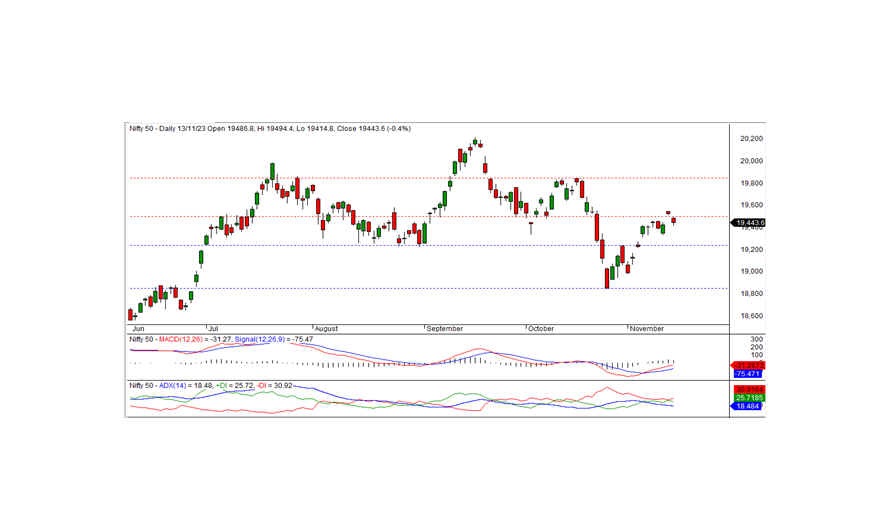
Following the market close on Monday, November 13, 2023, the Nifty concluded the trading session at 19443.55, registering a loss of -82.00 points or -0.42 percent. To re-establish the bullish trend, the Nifty must exceed the resistance level of 19500.
Commencing at 19486.80 with a negative bias, the Nifty sustained this trend, testing the intraday low at 19414.80 before ultimately closing at 19443.55. With the exception of PSU bank and metal sectors, all other sectors closed with a negative bias. The IT, financial services, media, and FMCG sectors experienced the most significant losses. Market breadth reflected negativity, with 997 stocks rising, 1348 falling, and 143 remaining unchanged. Under the Nifty, COAL INDIA, EICHERMOT, HINDALCO, and M&M emerged as the top gainers, while the major losers included SBILIFE, BAJFINANCE, INFY, and APOLLOHOSP.
From a technical standpoint, the Nifty maintains its position above short-term and long-term moving averages, with momentum indicators signaling a positive trend. However, the index formed a black candle on the daily chart and closed below the previous day's close, indicating a slightly negative bias. The nearest short-term resistance is at the 19500 level. If it remains below this level, the Nifty may consolidate for a few days. To sustain the bullish trend, the index needs to surpass the 19500 level.
Intraday support levels are identified at 19420, 19375, and 19325, while resistance levels are set at 19500, 19550, and 19600, according to 15-minute charts.
For positional traders, short-term support levels persist at 19233 and 18850, with resistance at 19500 - 19800.

BANK NIFTY
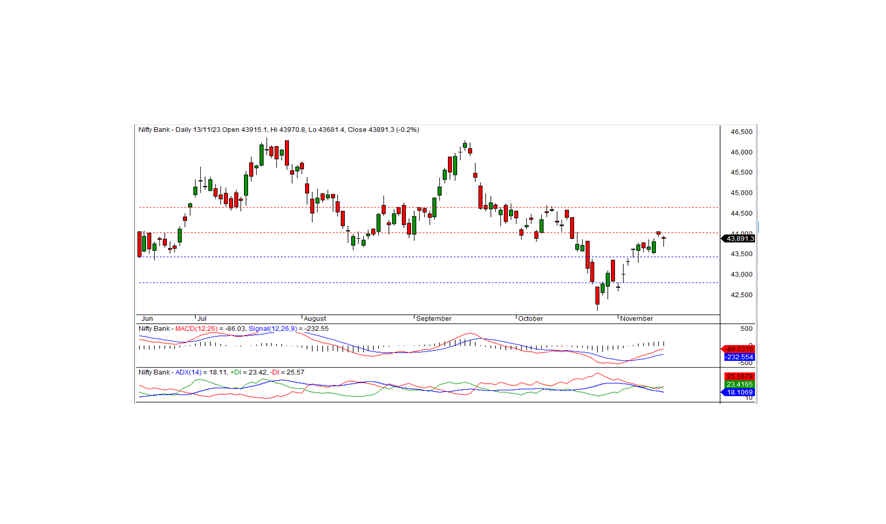
In the previous trading session, Bank Nifty concluded at 43891.25, marking a loss of -105.40 points. From a technical standpoint, momentum indicators continue to signal a positive trend, and the index remains positioned above the short-term moving averages.
However, the daily chart reveals the formation of a black candle, closing below the previous day's close, indicating a negative bias. The immediate short-term resistance stands at 44000. A breach beyond this level could reignite positive momentum in the upcoming days. Conversely, failing to surpass this level may lead to a consolidation phase below it for a few days.
For intraday traders, support levels are identified at 43860, 43700, and 43600, while resistance levels are observed at 44035, 44200, and 44350, according to the 15-minute charts.
Positional traders are advised to monitor short-term support levels at 43500-42800, with resistance ranging from 44000 to 44650.

