NIFTY TECHNICAL OUTLOOK
Based on the market closing date of Friday, November 3, 2023,
The Nifty concluded the session at 19,230.60, marking a gain of 97.35 points or 0.51 percent. The positive momentum can potentially persist if the index surpasses the 19,275 mark.
The trading day began with an upward gap as the Nifty opened at 19,241.00. It reached an intraday high of 19,276.30 during the morning session. The index maintained its position above the 19,210 level until it closed at 19,230.60. All sectors exhibited a positive bias, with notable gains in reality, media, banking, and IT. Market breadth favored the bulls, with 1,416 stocks rising, 918 falling, and 150 remaining unchanged.
Among Nifty stocks, APOLLOHOSP, ADANI PORTS, EICHERMOT, and LTIM performed strongly, while BAJAJFINSV, DR REDDY, SBILIFE, and INDUSINDBK experienced losses.
From a technical perspective, the Nifty closed above both its five and ten-day simple moving averages. However, the momentum indicators indicate a neutral trend. The daily chart displayed a small black candle, but it closed significantly higher than the previous day's close. This pattern suggests a shift in momentum favoring the bulls.
In the previous trading session, the Nifty closed near the upper limit of the recent trading range, which is between 18,837 and 19,233. If it keeps trading above 19,233, the short-term trend could become bullish. But if it can't, we might see ongoing consolidation in the days ahead.
Intraday Levels: Support Levels: 19,210 - 19,150 - 19,075 Resistance Levels: 19,275 - 19,350 - 19,400 (Based on 15-Minute Charts)
For Positional Traders: Short-term Support Levels: 18,800 - 18,500 Resistance Levels: 19,233 - 19,500

BANK NIFTY
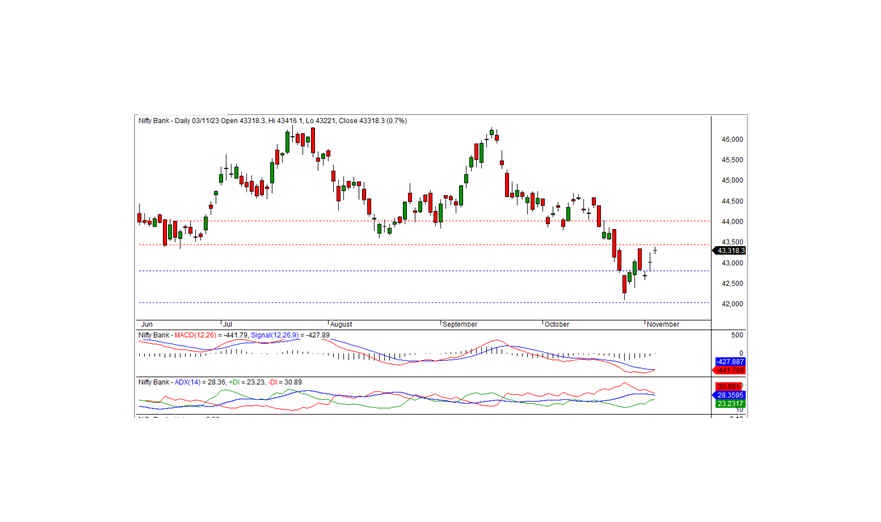
In the last trading session, Bank Nifty closed at 43,318.25, marking a gain of 301.05 points. From a technical standpoint, momentum indicators suggest a neutral trend, but the index closed above its short-term moving averages.
On the daily chart, the index formed a Doji candle and concluded near the short-term resistance level of 43,500. These factors collectively indicate a shift in momentum favoring the bulls. If the index continues to trade and hold above 43,500, it could lead to a bullish trend. Otherwise, consolidation may persist for a few more days.
For intraday traders, noteworthy support levels are at 43,225, 43,050, and 42,850, while resistance levels can be identified at 43,400, 43,600, and 43,800, as indicated by the 15-minute charts.
Positional traders should keep a close watch on short-term support levels ranging from 42,800 to 42,000, with resistance in the range of 43,500 to 44,000.

