NIFTY Technical Analysis
Based on Market Closing on Monday, November 06, 2023
The Nifty closed at 19,411.75, recording a gain of 181.15 points, or 0.94%. This positive trend can be sustained as long as the index remains above 19,375.
The Nifty opened at 19,345.80 level, exhibiting an upward gap. It maintained its bullish momentum throughout the session, reaching an intraday high of 19,423.00 before closing at 19,411.75. All sectors, except for PSU banks, showed a positive bias. The major gainers included the metal, pharma, realty, and private bank sectors. The market breadth was in favor of the bulls, with 1,609 stocks rising, 764 falling, and 113 remaining unchanged. Among the Nifty constituents, DIVISLAB, HEROMOTOCO, EICHERMOT, and LT were the top performers, while SBIN, HINDUNILVR, TITAN, and TATA MOTORS experienced losses.
From a technical perspective, the Nifty closed above its short-term moving averages, and momentum indicators signal a positive trend. Additionally, the index formed a white candle on the daily chart, closing well above the previous day's close, all pointing towards the potential continuation of the bullish trend. The nearest intraday support level is at 19,375. If the Nifty maintains levels above this, it may test the next short-term resistance at 19,500 in the upcoming session.
Intraday Levels: Support Levels: 19,375 - 19,300 - 19,250 Resistance Levels: 19,450 - 19,520 - 19,600 (15-Minute Charts)
For Positional Traders: Short-term Support Levels: 19,233 - 18,880
Resistance Levels: 19,500 - 19,800

BANK NIFTY Technical Analysis
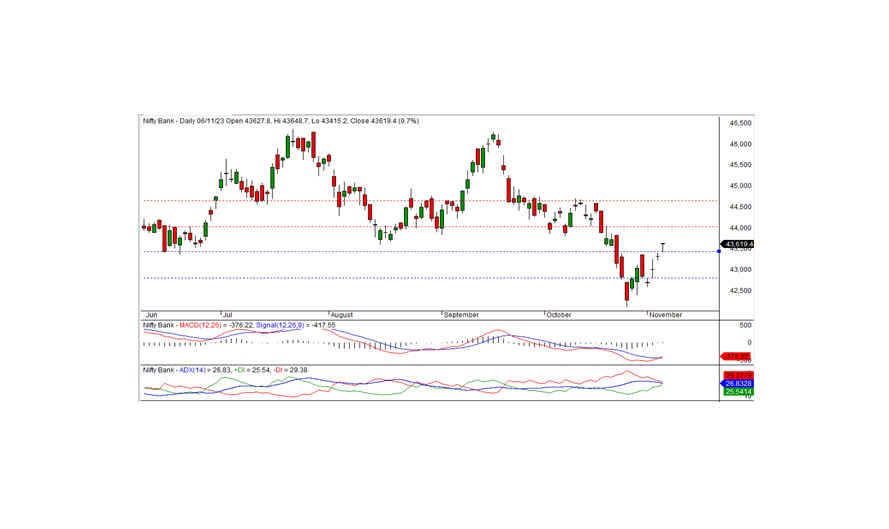
Bank Nifty concluded the trading session at 43,619.40, marking a notable gain of 301.15 points. From a technical standpoint, momentum indicators are signaling a positive trend, and the index closed above its short-term moving averages.
On the daily chart, the index formed its fourth consecutive Doji candle and closed above the previous resistance level of 43,500. All these factors indicate that the momentum continues to favor the bulls. If the index trades and stays above the 43,500 mark, the bullish trend is likely to persist in the upcoming days. The next short-term resistance level to watch for is at 44,000.
For Intraday Traders: Support Levels: 43,600, 43,400, and 43,200
Resistance Levels: 43,800, 44,000, and 44,200 (Based on 15-Minute Charts)
For Positional Traders: Pay attention to short-term support levels in the range of 43,500-42,800, with resistance levels between 44,000 and 44,650.

