NIFTY TECHNICAL OUTLOOK
As of the Market Closing on Thursday, November 16, 2023
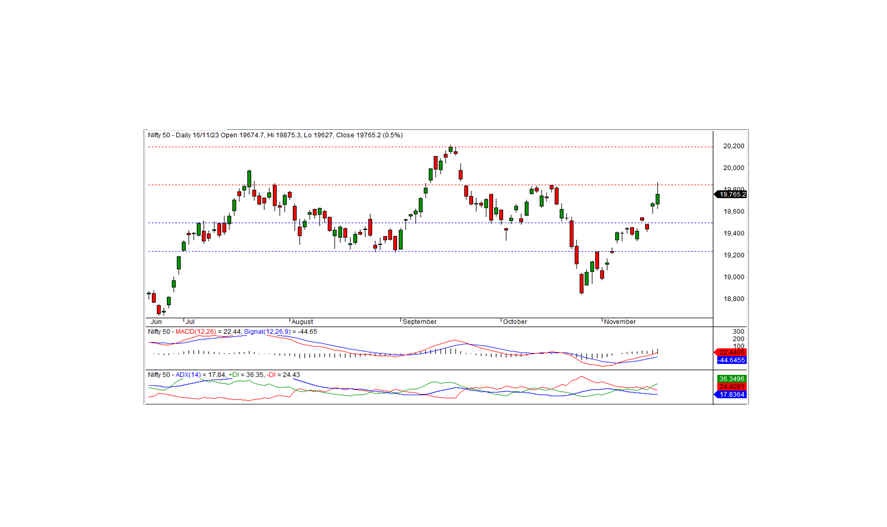
The Nifty concluded the trading session at 19765.20, registering a gain of 89.75 points or 0.46 percent. For the bullish trend to persist, it is crucial for the Nifty to close above 19850.
The day commenced with the Nifty opening at the 19674.70 level, exhibiting a flat note. The intraday low of 19627 was reached in the morning trade, followed by a surge that tested the intraday high of 19875.30. However, selling pressure in the closing session led to a final close at 19765.20. Noteworthy gainers included IT, realty, pharma, and auto sectors, while banks, FMCG, and metal sectors experienced losses. The market breadth remained positive, with 1200 stocks rising, 1168 falling, and 123 unchanged.
Under the Nifty, HEROMOTOCO, TECHM, TCS, and HCLTECH emerged as the top gainers, while AXISBANK, POWERGRID, COALINDIA, and TATACONSUM faced significant losses.
From a technical standpoint, the Nifty continues to maintain positions above short-term and long-term moving averages. Momentum indicators align with a positive trend. The daily chart reveals a white candle closing above the previous day's close, indicative of the momentum favoring the bulls. In the previous session, the index tested the short-term resistance at 19850 but failed to close above this level. In the upcoming session, a successful breach of this level could sustain the bullish momentum, with the next short-term resistance noted at 20200. Conversely, if the Nifty remains below the 19850 level, a consolidation phase may precede further up trends.
Intraday Levels (15-Minute Charts): Support: 19715 - 19635 - 19550 Resistance: 19800 - 19875 - 19950
For positional traders, short-term support is identified at 19500 - 19233, with resistance levels at 19850 - 20200.

BANK NIFTY Analysis:
In the last trading session, Bank Nifty concluded at 44161.55, marking a decline of -40.15 points. From a technical standpoint, momentum indicators suggest a positive trend, and the index maintains its position above short-term moving averages.
On the daily chart, the index formed a black candle and closed below the previous day's close, indicating a slightly negative bias. The short-term support at 44000 remains crucial. As long as the index holds above this level, the recent bullish trend is likely to persist in the upcoming days. The closest intraday resistance is situated at 44250 levels. A breach above this level could trigger a pullback rally for the day.
For intraday traders, key support levels are identified at 44060, 43900, and 43750, while resistance levels are at 44250, 44400, and 44600, as indicated by the 15-minute charts.
Positional traders are advised to monitor short-term support levels in the range of 44000-43500, with resistance observed between 44650 and 45500.

