NIFTY TECHNICAL UPDATE
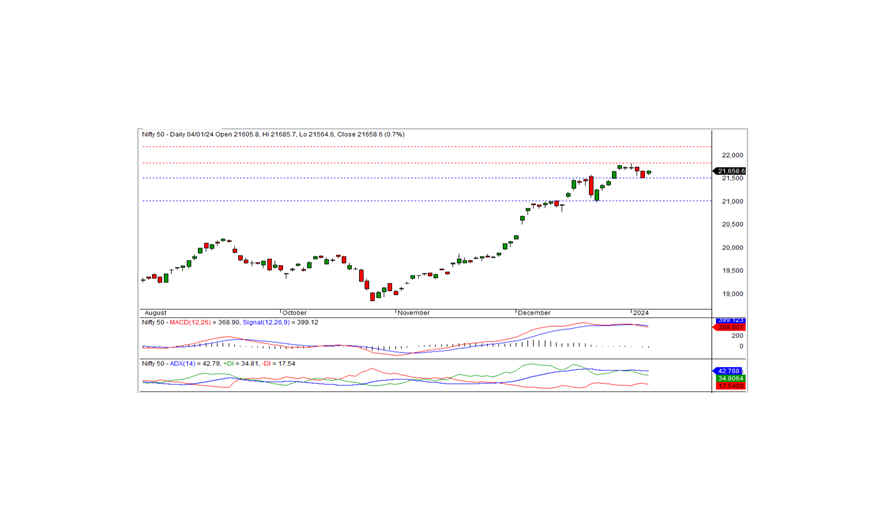
As of the market closing on Thursday, January 04, 2024, the Nifty concluded the trading session at 21658.60, marking a gain of 141.25 points or 0.66 percent. The positive momentum could persist if the Nifty surpasses the intraday resistance at 21685.
Commencing the session at 21605.80 with a positive inclination, the Nifty maintained this trend and reached an intraday high of 21685.70 before settling at 21658.60. Favorable market sentiment was evident across all sectors, with realty, financial services, banks, and FMCG leading the gains. The market breadth displayed positivity, witnessing 1530 stocks rising, 850 falling, and 129 remaining unchanged. Noteworthy gainers under the Nifty included BAJFINANCE, TATACONSUM, NTPC, and ONGC, while BPCL, LTIM, DR REDDY, and HCLTECH stood as the major losers.
From a technical standpoint, the Nifty maintains its position above both medium and long-term moving averages, while momentum indicators suggest a neutral trend. The daily chart reveals the formation of a small white candle within the previous day's black candle, resembling a Bullish Harami pattern. This pattern implies a potential reversal of the bearish trend. Confirmation of this reversal would require the index to trade and sustain above the high of the Harami pattern in the coming days. On the upside, the index faces intraday resistance at 21685, with the nearest intraday support at 21620 levels.
Intraday Support levels: 21620-21565-21500 Resistance levels: 21685-21750-21825 (15 Minute Charts)
For positional traders, short-term support levels are at 21500-21000, with resistance at 21835-22200.

BANK NIFTY UPDATE
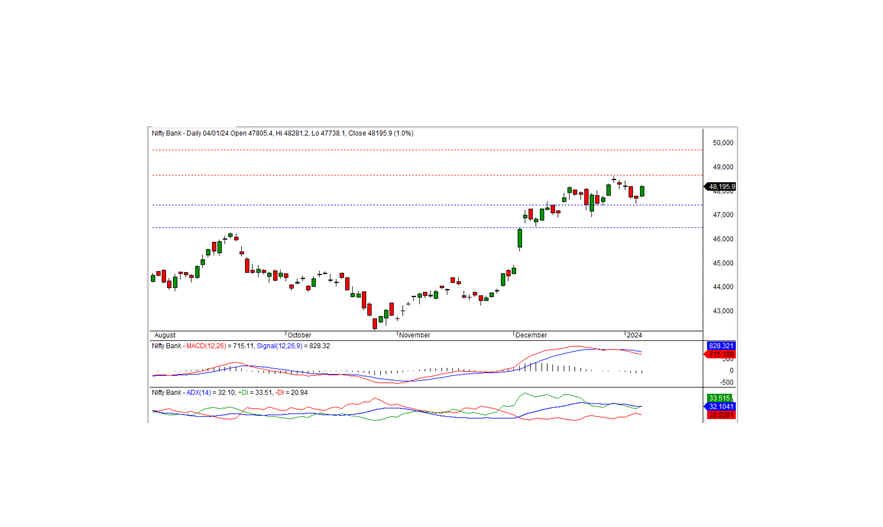
In the previous trading session, Bank Nifty concluded at 48195.85, securing a gain of 490.90 points. From a technical standpoint, momentum indicators suggest a neutral trend, yet the index remains positioned above the short-term moving averages. Notably, a white candle formed on the daily chart, closing near the day's high.
On the upside, the index encounters intraday resistance at 48300 levels. The potential for a sustained positive trend exists if the index surpasses this level, while the nearest intraday support is identified at the 48100 level.
For intraday traders, key support levels are positioned at 48100, 47900, and 47700, with corresponding resistance levels at 48300, 48450, and 48600 as indicated by the 15-minute charts.
Positional traders are advised to observe short-term support levels at 47400-46500, with resistance levels marked at 48650-49700.

