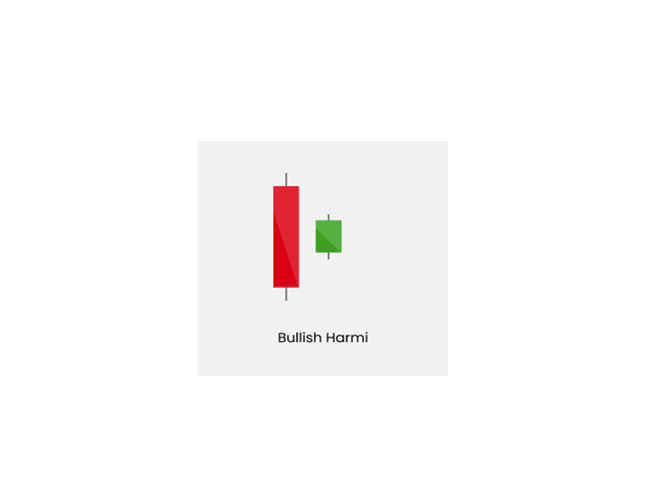
The Bullish Harami Pattern
The bullish harami pattern is a two-day candle pattern that can indicate a potential trend reversal in a stock or index. This pattern consists of a large black candle on the first day, followed by a small white candle enclosed within the body of the previous day's candle. If this pattern appears at the bottom of a downtrend, it may be considered a bullish reversal pattern.
The small white candle opening with a gap near the mid-range of the previous black candle and closing inside the black candle indicates a potential change in momentum. However, the bullish harami candlestick should not be considered as a sole confirmation of a bullish trend. It should be used in conjunction with other technical indicators and factors.
To confirm the bullish trend, traders should wait for the price to trade and sustain above the high of the harami pattern in the coming days. Additionally, it's important to check other technical parameters before entering into a trade.
Overall, the bullish harami pattern can be a useful tool for traders in identifying potential trend reversals, but it's important to use it in conjunction with other factors and indicators to make informed trading decisions.