NIFTY TECHNICAL OUTLOOK
Based on Market Closing on Wednesday, January 31, 2024
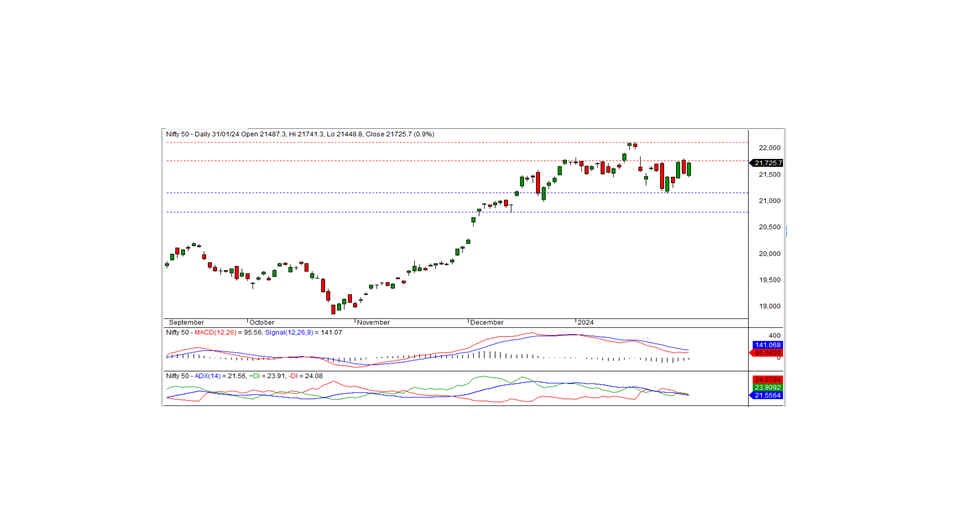
In the last trading session, the Nifty closed at 21725.70, marking a gain of 203.60 points or 0.95 percent. To sustain the bullish trend, the index needs to surpass the resistance of 21750.
The Nifty opened at the 21487.30 level with a negative bias and hit an intraday low of 21448.80 during morning trade. However, the index gradually climbed and tested the intraday high of 21741.30 before closing at 21725.70. All sectors closed with a positive bias, with notable gains seen in the pharma, realty, PSU banks, and auto sectors. Market breadth was positive, with 1556 stocks rising, 874 falling, and 93 remaining unchanged. Among Nifty constituents, DR REDDY, EICHERMOT, SUN PHARMA, and DIVISLAB were the top gainers, while LT, TITAN, TATACONSUM, and BPCL were among the major losers.
From a technical perspective, the Nifty remains above both short-term and long-term moving averages. Momentum indicators signal a negative bias, although the index formed a long white candle on the daily chart and closed near the day's high. Short-term resistance is observed at 21750. If the index surpasses this level, the bullish trend may extend in the coming days; otherwise, recent consolidation may persist for a few more days.
Intraday Support Levels: 21650-21565-21475 Resistance Levels: 21750-21850-21950 (15-Minute Charts)
For positional traders, short-term support levels are at 21160-20780, with resistance at 21750-22125.

BANK NIFTY
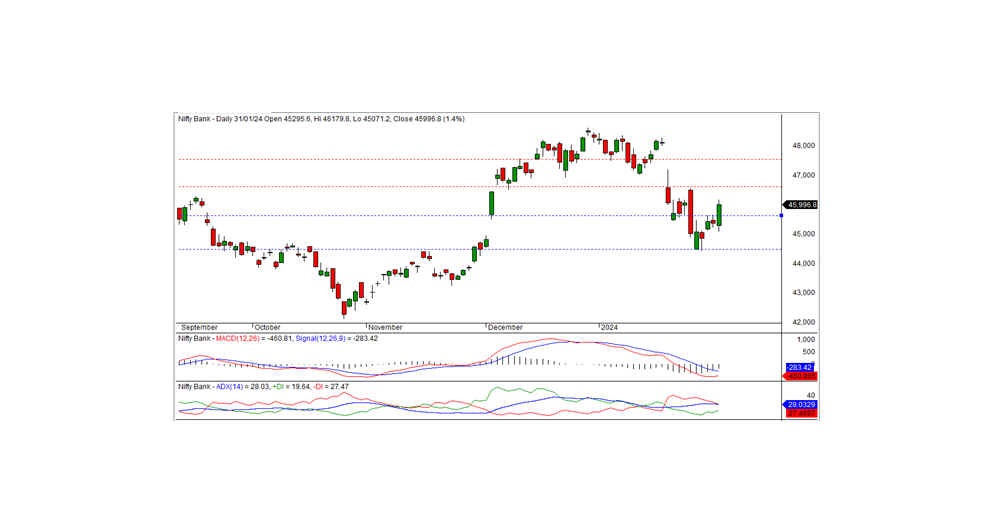
In the preceding trading session, Bank Nifty closed at 45996.80, marking a gain of 629.05 points. Technically, momentum indicators signal a negative trend. However, the index closed above the short-term moving averages. Furthermore, it formed a long white candle on the daily chart and closed above the previous resistance of 45600. If the index remains above this level, the bullish trend can extend in the coming days. The next short-term resistance is identified at 46600.
For intraday traders, support levels are at 45850, 45600, and 45300, while resistance levels can be identified at 46175, 46400, and 46600, as indicated by the 15-minute charts.
Positional traders should monitor short-term support levels at 45600-44450, with resistance noted at 46600-47550.

