Black candles and their significance in technical analysis
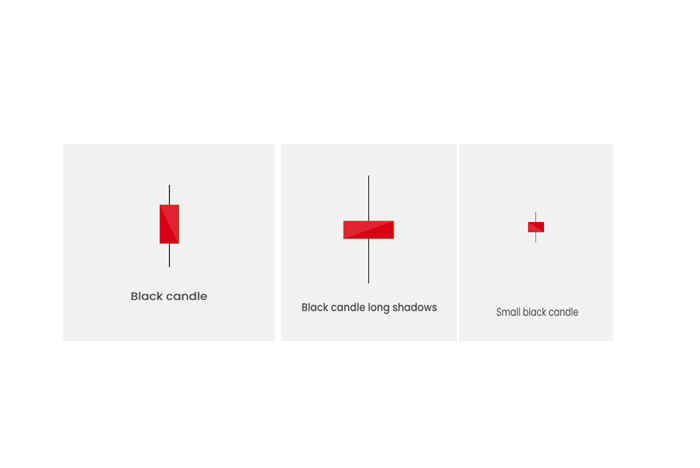
Black candles are identified by a closing price lower than the opening price, indicating a downward trend. However, they can vary in size and shape, and there are three main types: black candles with a large body, black candles with long shadows, and black candles with small real bodies and shadows.
Black candles with a large body indicate a significant price move from the open to the close, suggesting a strong bearish sentiment in the market. Long black candlesticks indicate strong selling pressure, with the closing price near the low of the candle. Black candles with long shadows indicate high volatility and can indicate a trend reversal soon. On the other hand, short candles have short bodies, indicating a period of consolidation in a stock or asset, where buyers and sellers are in balance.
It is important to note that single black candle patterns have significance, but their importance increases when analyzed with two or more candle patterns. Technical analysts use candlestick charts to identify such patterns and to predict potential trend reversals or continuations in the market.
In summary, black candles come in different shapes and sizes, and each type provides valuable information about the market sentiment and potential future price movements. Traders and investors use these patterns in conjunction with other technical analysis tools to make informed decisions and manage risk effectively.

