NIFTY Technical Analysis
As of Market Close on Monday, April 15, 2024
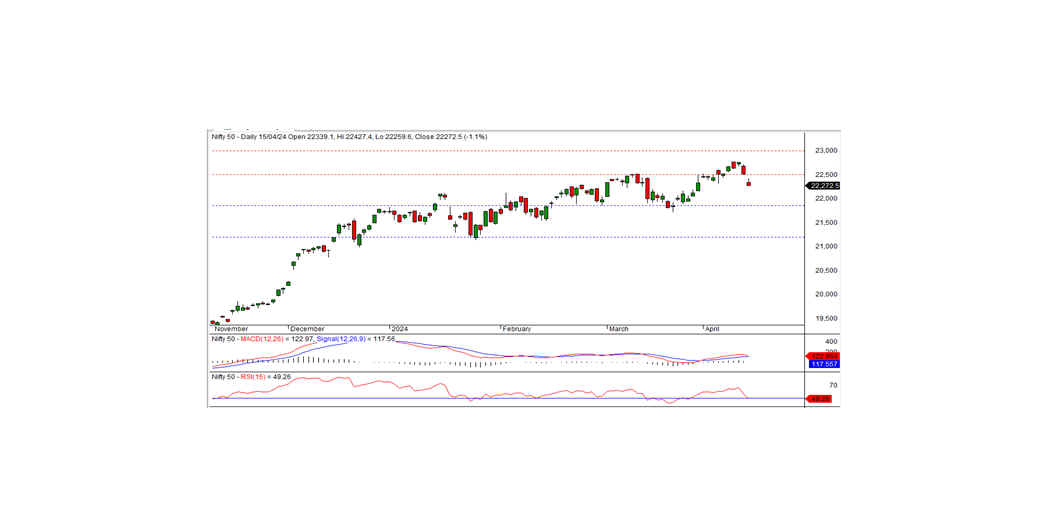
In the latest trading session, the NIFTY concluded at 22,272.50, experiencing a decline of -246.90 points or -1.10 percent. The prevailing downtrend is likely to persist should the NIFTY trade and maintain levels below the support range of 22,250-22,180.
Opening at 22,339.10 in the last session with a negative sentiment, the NIFTY sustained its downward trajectory, reaching an intraday low of 22,259.60 before settling at 22,272.50. Most sectors concluded with a negative bias, with notable losses seen in media, PSU banks, financial services, and private banks. Market breadth favored the downside, with 423 stocks on the rise, 2054 declining, and 115 remaining unchanged. Among the NIFTY constituents, top gainers included ONGC, HINDALCO, MARUTI, and NESTLEIND, while significant losses were observed in SHRIRAMFIN, BAJAJFINSV, WIPRO, and ICICIBANK.
From a technical perspective, the NIFTY closed below both short-term moving averages. Momentum indicators signal a neutral trend. Notably, a black candle formed on the daily chart, with the index closing near its intraday low. The immediate support lies at the 22,250-22,180 area, and a sustained trade below these levels could extend the downtrend in the upcoming sessions. The nearest intraday resistance is anticipated at 22,350 levels.
Intraday Levels: Support - 22,250, 22,180, 22,100 Resistance - 22,350, 22,425, 22,500 (15-Minute Charts)
Positional Trading: Short-term Support - 21,850-21,200 Resistance - 22,500-23,000
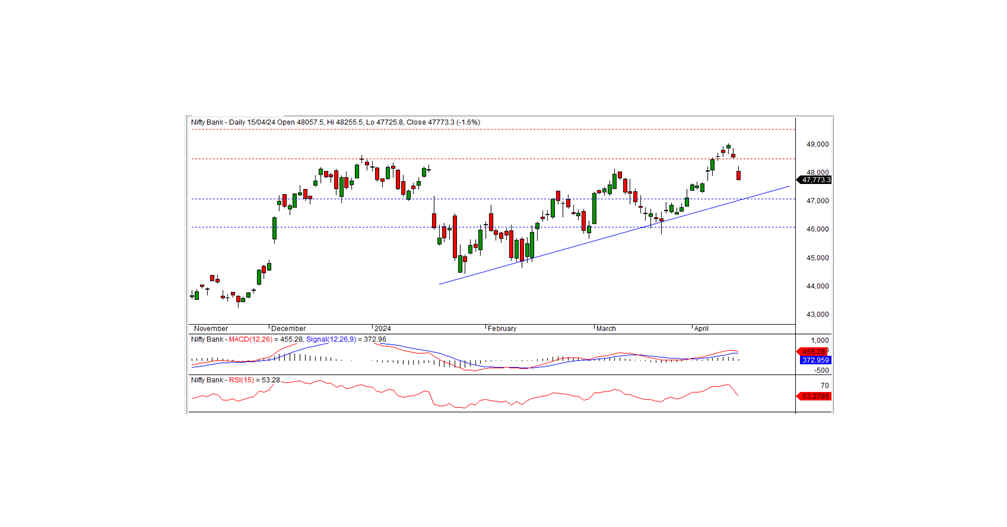
Bank NIFTY Technical Analysis
In the previous trading session, Bank NIFTY concluded at 47,773.25, marking a loss of -791.30 points. From a technical standpoint, momentum indicators signal a positive trend, yet the index closed below its short-term moving averages. Additionally, a black candle formed on the daily chart, closing near the session's low.
In terms of support, the index has intraday backing at 47,700 levels. Sustained trading below this level could prolong the downtrend. The subsequent short-term support is anticipated in the 47,200-47,000 range. The nearest intraday resistance is positioned at 48,000; a breakthrough beyond this level is essential for a potential pullback rally.
For intraday traders, support levels are identified at 47,700, 47,450, and 47,200, with resistance levels at 48,000, 48,200, and 48,500, as depicted by the 15-minute charts.
Positional traders are advised to monitor short-term support levels at 47,000-46,000, while resistance is anticipated at 48,500-49,500.