NIFTY TECHNICAL ANALYSIS
Based on Market Closing on Thursday, May 09, 2024
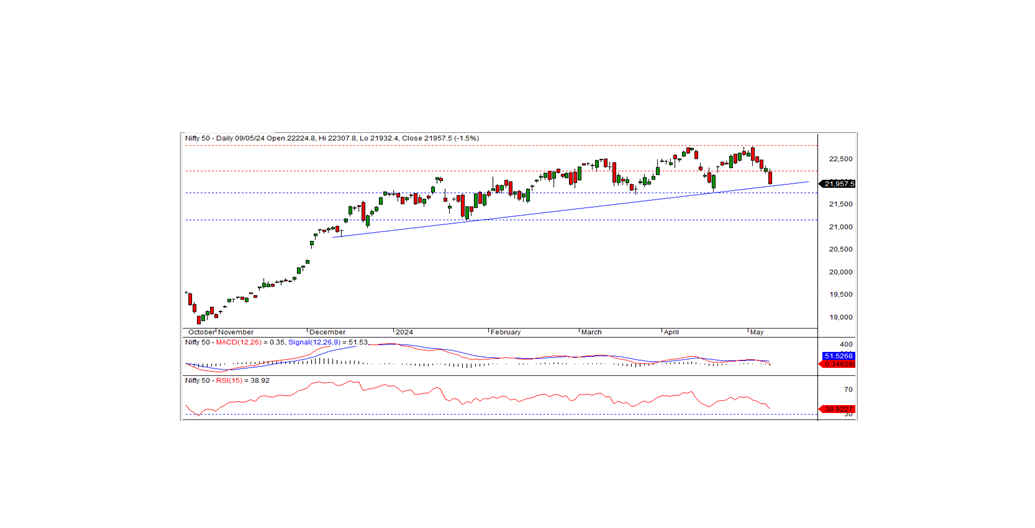
The Nifty concluded in the previous trading session at 21957.50, marking a decline of -345.00 points or -1.55 percent. The bearish sentiment is likely to persist if the Nifty continues trading below the 21900 level.
Commencing the session at 22224.80 with a negative tone, before moving further down the Nifty made an intraday high of 22307.80 in the morning. Then the index gradually fell and hit the intraday low of 21932.40, before closing at 21957.50. Except for auto, all sectors closed with a downward inclination. Major sectoral losers encompassed metal, FMCG, realty, and pharma. The market breadth depicted a negative stance, with 414 stocks rising, 2057 falling, and 131 remaining unchanged. Notable gainers within the Nifty included HEROMOTOCO, TATAMOTORS, M&M, and BAJAJ-AUTO, while prominent losers comprised LT, ASIAN PAINTS, BPCL, and COAL INDIA.
Technically, the Nifty trails below short-term moving averages, with momentum indicators signaling a bearish trend. Additionally, the index formed a long black candle on the daily chart, concluding near the day's low, indicative of the downward momentum. On the downside, the nearest support remains within the range of 21900 to 21750. Should the index breach these levels, the downtrend may persist in the upcoming days. On the higher side, the intraday resistance is at 22000 levels. For a pullback rally, the index needs to surpass this level.
Intraday Levels: Support - 21900, 21800, 21700; Resistance - 22000, 22100-22200 (15-Minute Charts)
Positional Trading: Short-term Support - 21750-21150; Resistance - 22250-22800.

BANK NIFTY OUTLOOK
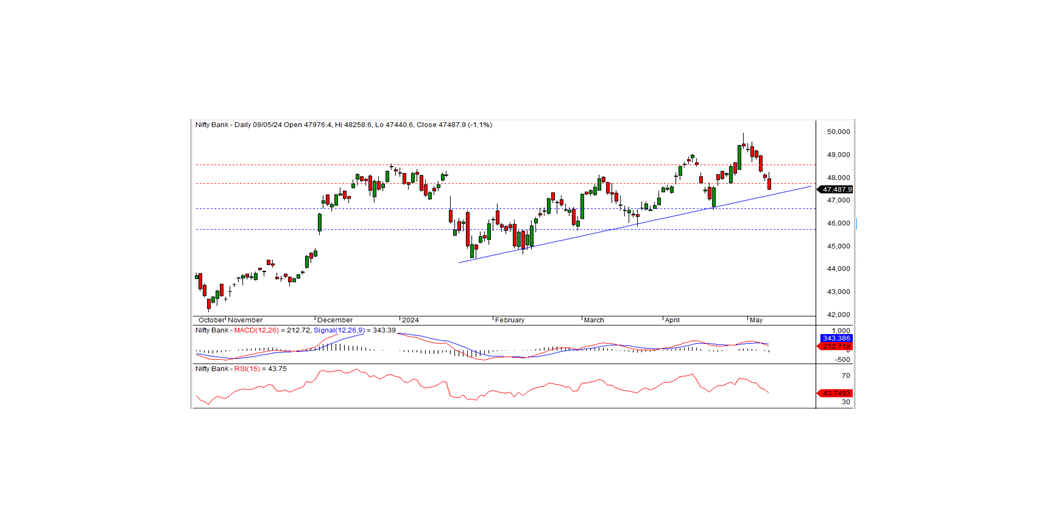
In the preceding trading session, the Bank Nifty concluded at 47487.90, marking a loss of -533.20 points. From a technical perspective, momentum indicators continue to signal a negative trend, with the index persisting below short-term moving averages. Furthermore, a black candle formation on the daily chart, coupled with a close near the day's low, suggests a potential continuation of the downtrend.
On the lower side, the index has trend line support at the 47150 level. If the index closes below this level, the downtrend can continue in the coming days. The nearest intraday resistance is at the 47700 level, a breakthrough above this level is essential for a potential pullback rally.
For intraday traders, support levels are identified at 47400, 47150, and 46900, while resistance levels are observed at 47700, 47900, and 48250, as indicated by the 15-minute charts.
Positional traders are advised to monitor short-term support levels at 46650-45700, with resistance noted at 47750-48500.

