NIFTY Technical Outlook
Based on Market Closing on Friday, July 19, 2024
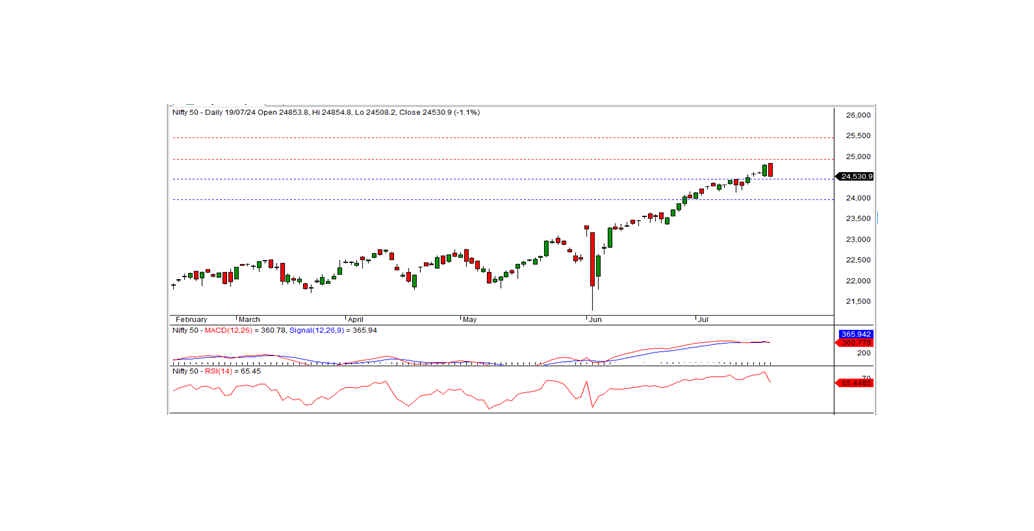
In the last trading session, the Nifty closed at 24,530.90, down 269.95 points or -1.09%. The downtrend is expected to continue if the index moves below the intraday support level of 24,500.
The Nifty opened at 24,853.80 on a positive note, which was also the day's high. Subsequently, the index declined, hitting an intraday low of 24,508.20 before closing at 24,530.90. All sectors closed with a negative bias, with the metal, auto, realty, and media sectors being the top losers. The market breadth was negative, with 426 stocks rising, 2,109 falling, and 104 remaining unchanged. The top gainers in the Nifty index were INFY, ITC, ASIANPAINT, and BRITANNIA, while the major losers included TATASTEEL, BPCL, HEROMOTOCO, and HINDALCO.
From a technical standpoint, the momentum indicators signal a neutral trend. The Nifty remains above the long-term and short-term moving averages. However, the index formed a black candle on the daily chart, closing near the day's low, which resembles a bearish engulfing pattern. This pattern suggests a potential slowdown in the recent uptrend and a possible shift to a downtrend. For confirmation, the index needs to trade and sustain below the bearish engulfing pattern in the coming days. The nearest intraday support is at 24,500. If the index moves below this level, the bearish trend is likely to continue. On the higher side, the index has intraday resistance at 24,600.
Intraday Levels: Support: 24,500, 24,400, 24,300 Resistance: 24,600, 24,700-24,800 (15-Minute Charts)
Positional Trading: Short-term Support: 24,500-24,000 Resistance: 25,000-25,500
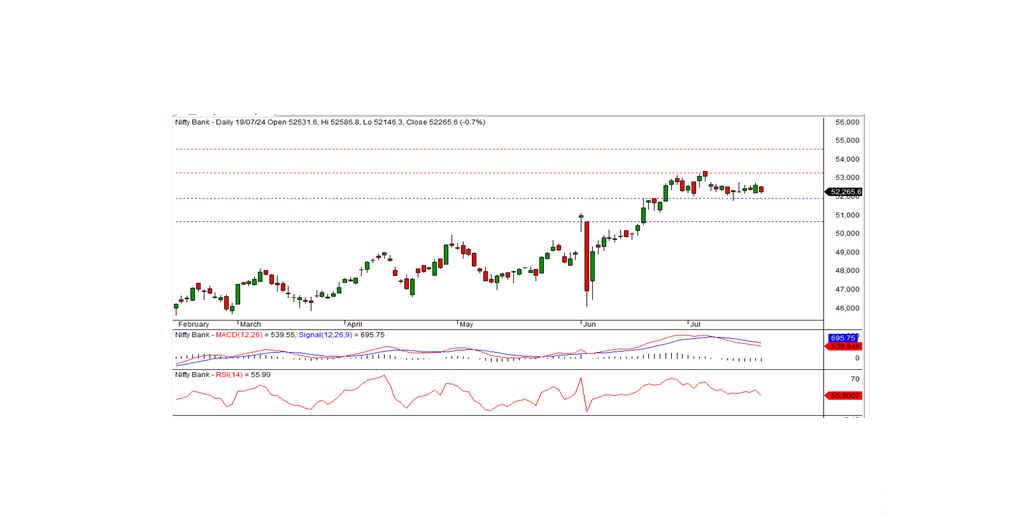
BANK NIFTY Technical Outlook
In the preceding trading session, Bank Nifty closed at 52,265.60, registering a loss of 355.10 points. Technically, the momentum indicators signal a neutral trend. The index closed below the short-term moving averages. Additionally, it formed a black candle on the daily chart, closing inside the previous day's close, which resembles a bearish harami pattern. This pattern suggests a potential reversal of the bullish trend. For confirmation, the index should trade and sustain below the harami pattern low in the coming days. On the lower side, the index has intraday support at the 52,200 level. If the index moves below this level, the bearish trend may continue. The nearest intraday resistance is at 52,400.
Intraday Levels: Support: 52,200, 52,000, 51,800 Resistance: 52,600, 52,800 (15-Minute Charts)
Positional Trading: Short-term Support: 51,900-50,650 Resistance: 53,250-54,500