NIFTY TECHNICAL ANALYSIS
UPDATE AS OF November 20, 2023
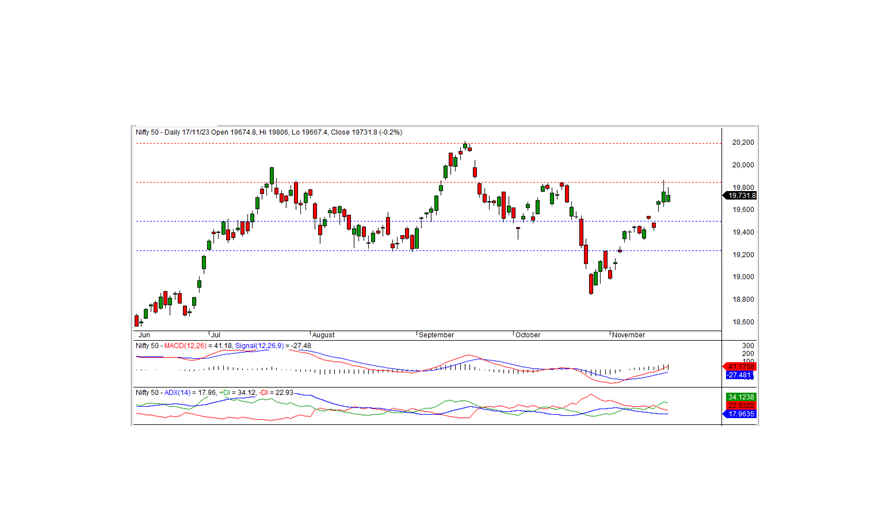
Following the market close on Friday, November 17, 2023, the Nifty concluded the trading session at 19,731.80, experiencing a decline of -33.40 points or -0.17 percent. To trigger a potential rebound, the index must surpass the 19,800 level.
Commencing the day at 19,674.80, the Nifty initiated trading on a negative note, reaching an intraday low of 19,667.40 during the morning session. Subsequently, the index exhibited an upward trajectory, achieving an intraday high of 19,806 before settling at 19,731.80. Noteworthy sector performances included gains in pharma, FMCG, auto, and realty, while banks, financial services, and IT sectors incurred losses. Market breadth favored positivity, with 1,232 stocks rising, 1,124 falling, and 135 remaining unchanged. Top gainers beneath the Nifty umbrella comprised SBILIFE, HDFCLIFE, APOLLO HOSP, and LT, whereas major losers included SBIN, AXISBANK, ONGC, and BPCL.
From a technical standpoint, the Nifty maintains positions above both short-term and long-term moving averages, with momentum indicators signaling a positive trend. The daily chart revealed the formation of a white candle, albeit closing below the previous day's close, suggesting a potential consolidation phase. On the downside, intraday support stands at the 19,715 level, and a breach below this could extend the downward trend. The nearest intraday resistance lies at 19,800 levels, and a breakthrough may trigger a pullback rally. To reaffirm a bullish trend, the Nifty must close above the 19,850-19,875 range.
Intraday Support Levels: 19,715 - 19,635 - 19,550 Resistance Levels: 19,800 - 19,875 - 19,950 (15-Minute Charts)
For positional traders, short-term support levels persist at 19,500-19,233, with resistance at 19,850-20,200.

BANK NIFTY - MARKET UPDATE
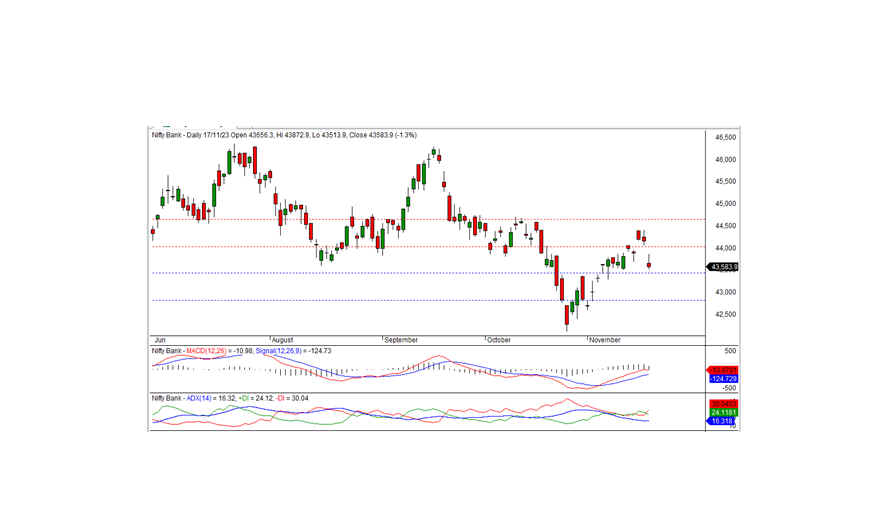
In the previous trading session, Bank Nifty concluded at 43,583.95, witnessing a decline of -577.60 points. Analyzing the technical aspects, momentum indicators indicate a positive trend; however, the index closed below the short-term moving averages.
Adding to the analysis, the index formed a black candle and concluded below the preceding day's close, signaling a negative bias. The immediate short-term support stands at 43,500. If the index remains above this level, a potential pullback rally may unfold today. Conversely, a breach below this level could sustain the negative trend.
For intraday traders, key support levels are identified at 43,500, 43,300, and 43,100, while resistance levels are observed at 43,700, 43,900, and 44,100, as indicated by the 15-minute charts.
Positional traders are advised to monitor short-term support levels at 43,500-42,800, with resistance ranging between 44,000 and 44,650. Staying vigilant within this range is crucial for strategic decision-making in the current market scenario.

